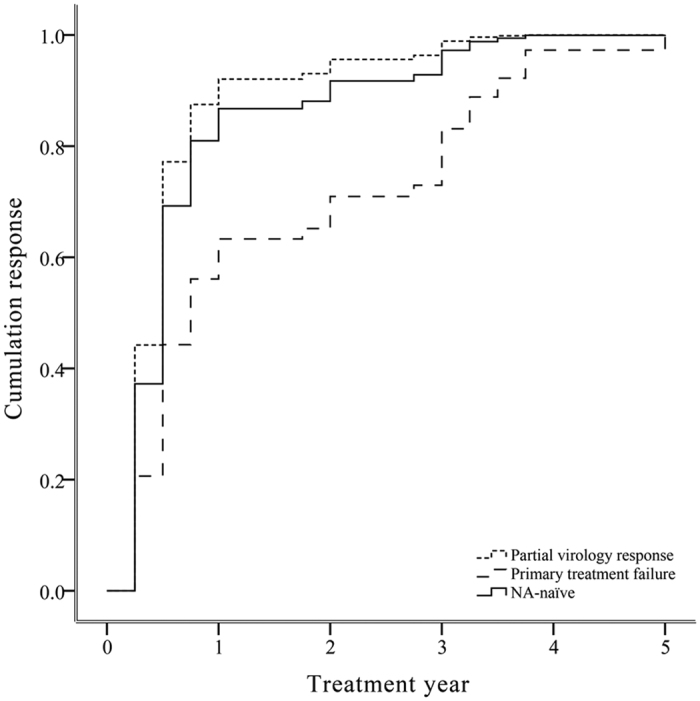
Figure 3. Adjusted estimated survival curve for the cumulative probability of achieving virologic response for NA-naïve and different subsets of ADV-experienced CHB patients.

Based on the Cox’s model for baseline HBV DNA, ALT level and HBeAg status.

Based on the Cox’s model for baseline HBV DNA, ALT level and HBeAg status.