Figure 1.
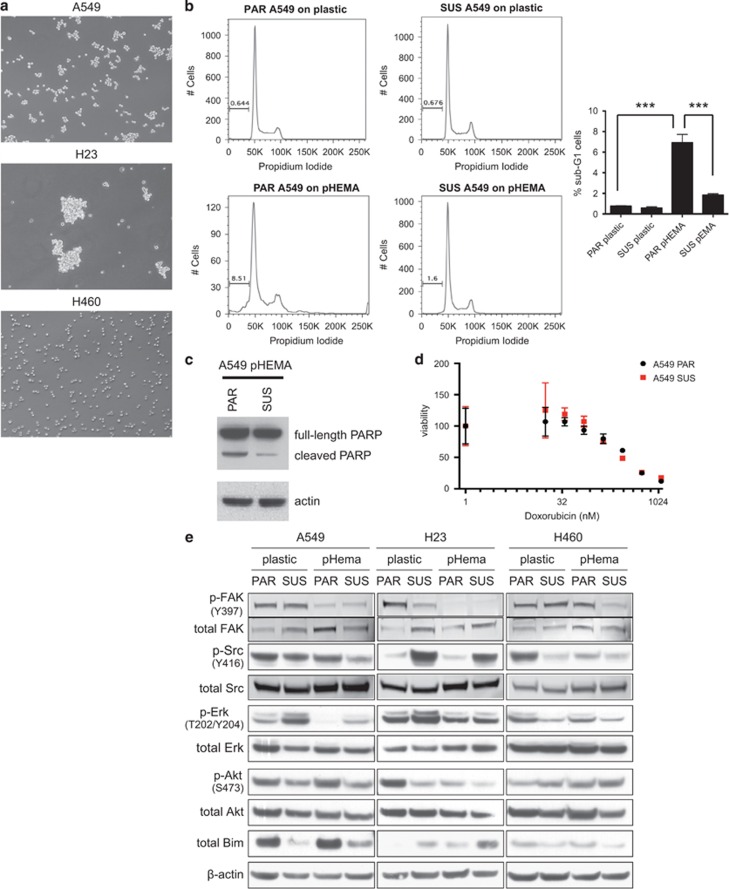
Characterization of the suspension-derived sublines. (a) Light microscopy images (× 10) of A549, H23 and H460 SUS cell lines growing in suspension (on polyHEMA) for at least 48 h. (b) A549 SUS cells have reduced sub-G1 population relative to A549 PAR cells when grown on polyHEMA. DNA content assessed by fluorescence-activated cell sorting. The percentage of the sub-G1 population is labelled (left). Histogram showing an average sub-G1 apoptotic population (n=3) (right). Following a one-way analysis of variance, the P-values were determined to be 0.00003 comparing PAR plastic and PAR pHEMA and 0.000124 comparing PAR pHEMA and SUS pHEMA, n=3. (c) Apoptosis induction assessed by poly ADP-ribose polymerase cleavage in A549 PAR compared with attenuated response in SUS cells grown on polyHEMA. (d) A549 PAR and SUS cell lines were treated in triplicates with serial dilutions of doxorubicin in adherent conditions. (e) Cell signalling profiling of parental and suspension A549, H23 and H460. Cells were cultured for 48 h on plastic or on polyHEMA. Cell extracts were subjected to immunoblotting with p-FAK(Y397), p-Src (Y416), p-Erk (T202/Y204), p-Akt (S473), Bim, total FAK, Src, Erk, Akt and β-actin antibodies.

