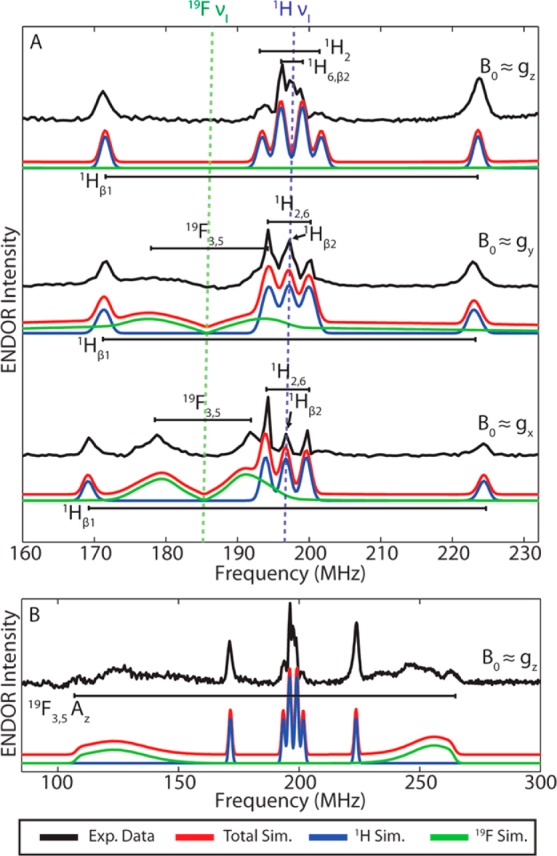
Figure 6.

(A) Field-dependent D-band Davies ENDOR of (3,5)F2Y· in RNR β2 in the frequency range from 160–233 MHz. Experimental data are shown in black, the total simulated spectrum is in red, and isolated contributions from 1H and 19F nuclei are in blue and green, respectively. Resolved peaks and assigned nuclei are denoted with black brackets. (B) Full ENDOR spectrum acquired at B0 ≈ gz (4643 mT). Broad signal associated with the 19F3,5Az component is denoted with the black bracket below the experimental spectrum. Acquisition parameters: Temperature = 30 K; MW Frequency = 129.996 GHz; π/2MW = 37.5 ns; πRF = 24 μs; τ = 300 ns; shot rep time (srt) = 10 ms.
