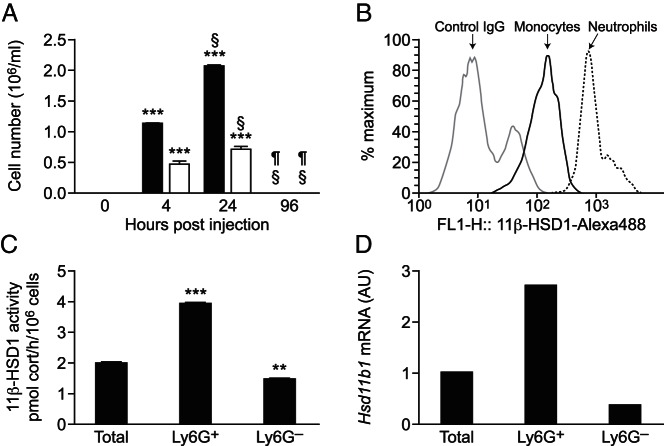
Figure 2. Thioglycollate-elicited neutrophils express 11β-HSD1.
A, Flow cytometry was used to determine the number of neutrophils (black bars; Ly6G+7/4+CD11b+) and monocytes (white bars; Ly6G−7/4+CD11b+) in peritoneal lavages collected 0, 4, 24, or 96 hours after the injection of 300 μL of 10% thioglycollate. Data are means ± SEM and were analyzed by an ANOVA, with Tukey's post hoc tests, ***, P < .001, compared with 0 hours; §, P < .001 compared with 4hours; ¶, P < .001 compared with 24 hours (n = 6–8 mice/group). B, Representative histogram (of eight mice) from flow cytometry showing strong positive staining of 11β-HSD1 in neutrophils (black line), to a lesser degree in monocytes (dark gray line), and negative control staining (light gray) in cells lavaged 24 hours after the thioglycollate injection. C, 11β-HSD1 activity assay performed on freshly isolated neutrophils lavaged 24 hours after the thioglycollate injection: conversion of 200 nM [3H]-11-dehydrocorticosterone to corticosterone, expressed as picomoles corticosterone per hour per 106 cells. Values are mean ± SEM of three independent pools of peritoneal cells (each from three mice) and were analyzed using an ANOVA with Tukey's post hoc tests. **, P < .01, ***, P < .001, compared with total cells. D, Real-time PCR measurement of 11β-HSD1 mRNA levels in purified neutrophils collected 24 hours after the thioglycollate injection. Each value represents a single pool of cells from five mice and is in arbitrary units (AU), with the level in total cells arbitrarily set to 1.0.

