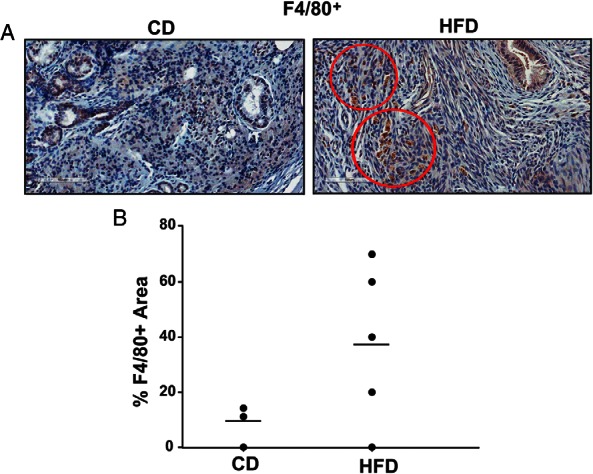
Figure 2. Macrophage F4/80+ cells in CD and HFD ectopic lesions in mice.

A, Representative sections of ectopic lesions harvested from CD- and HFD-fed mice, showing positive immunostaining for F4/80 in HFD lesion-stromal cells. Scale bar, 100 μm. B, Graph represents percentages of F4/80+ areas in stromal cells of CD or HFD ectopic lesions, determined by counting the number of immunopositive areas over the total number of stromal areas evaluated ×100. Each point represents a lesion from an individual mouse.
