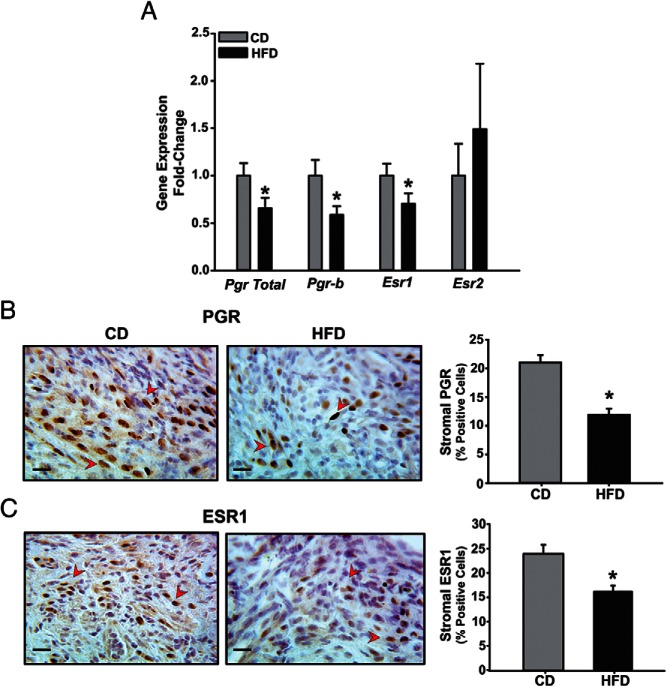
Figure 3. ESR and PGR are differentially expressed in CD and HFD ectopic lesions in a mouse model.
A, Transcript levels of Pgr and Esr isoforms were determined in CD or HFD lesions by QPCR. Data (mean ± SEM) are expressed as FC from CD lesion group and were obtained from n = 7 lesions, with each lesion isolated from an individual mouse per diet group. B and C, Representative sections of CD and HFD ectopic lesions showing PGR-positive (B) and ESR1-positive (C) stromal cells (indicated by red arrowheads). Four lesions per dietary group, each representing an individual mouse, were analyzed. Scale bar, 20 μm. For B and C, the percentages of immunostaining cells (expressed as mean ± SEM) were quantified by counting the number of immunopositive stromal nuclei over the total number of stromal cells per field and are presented as bar graphs; *, P < .05 by Student's t test.

