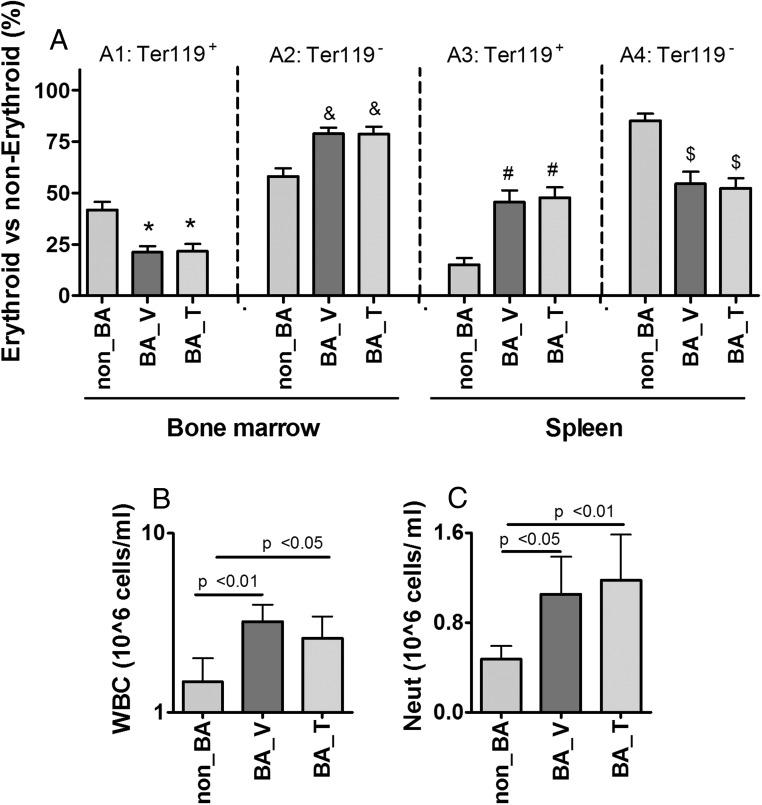
Figure 2. Effects of chronic treatments with HKBA with and without T on cell population distribution in bone marrow and spleen as well as WBCs in circulation.
A, Percentage of erythroid (Ter119+) and nonerythroid (Ter119−) cells over total cells in bone marrow and spleen, as labeled in the graph. B, Peripheral WBC count (1 × 10⁶ cells/mL), presented in log scale and statistics was performed after log transformation. C, Peripheral neutrophil count (1 × 10⁶ cells/mL). Non_BA, control mice injected with saline and oil; BA_V, mice treated with HKBA and vehicle oil; BA_T, mice treated with HKBA and T. For A, N = 8 samples was randomly selected for each group. For B and C, N = 11 for non_BA, N = 13 for BA_V, and N = 15 for BA_T groups, respectively. Results are shown as mean ± 95% CI, and analyzed using one-way ANOVA. Post hoc pairwise comparison was performed using Tukey HSD test, with the P values for paired Tukey's tests indicated in the graphs.

