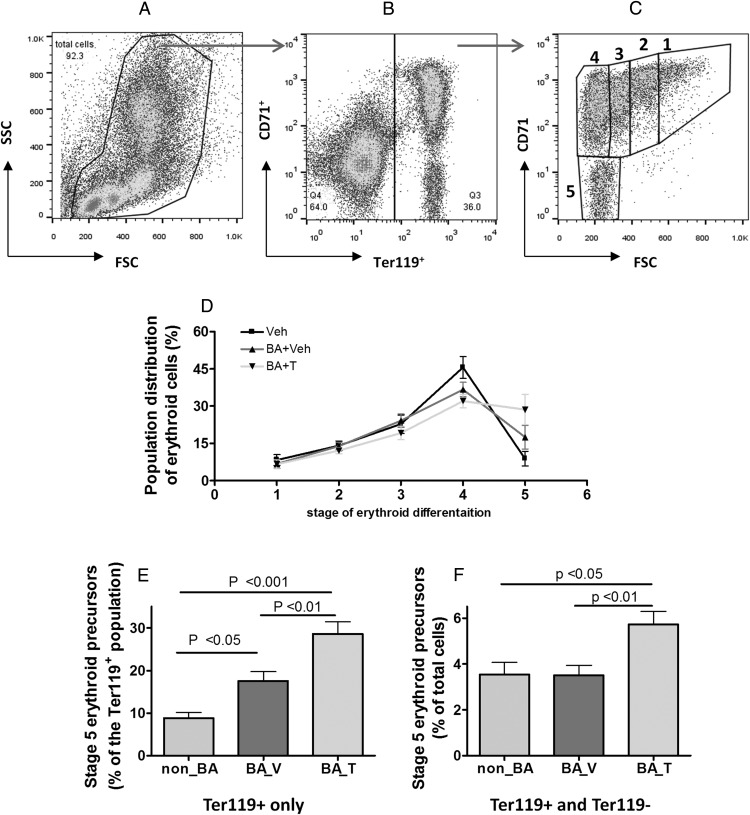
Figure 3. Effects of chronic treatment with HKBA with and without T on bone marrow erythroid cell distribution across the five stages of differentiation.
A–C, illustration of the strategy for gating the cell populations identified using flow cytometry. A, Cells are displayed according to their sizes and a gate is set to include all identified individual cell (FSC: forward scatter, SSC: sideway scatter). B, Cells gated from A are displayed according to their expression levels of surface erythroid marker (Ter119) and transferrin receptor (CD71). A second gate is selected to identify all cells that are Ter119+ with different CD71 levels. C, Cells gated from B are displayed according to their size (FSC) and surface CD71 levels and subdivided into five stages of differentiation as illustrated in the graph. D, Quantitative results of cell distribution across the stages 1–5. E, The percentage of cells at stage 5 normalized to total erythroid cells. F, The percentage of cells at stage 5 normalized to total cells. Non_BA, control mice injected with saline and oil; BA_V, mice treated with HKBA and vehicle oil; BA_T, mice treated with HKBA and T. N = 8 samples was randomly selected for each group. Results were analyzed by one-way ANOVA and post-hoc Tukey HSD test. The P values for paired Tukey's tests are indicated in the relevant graphs.

