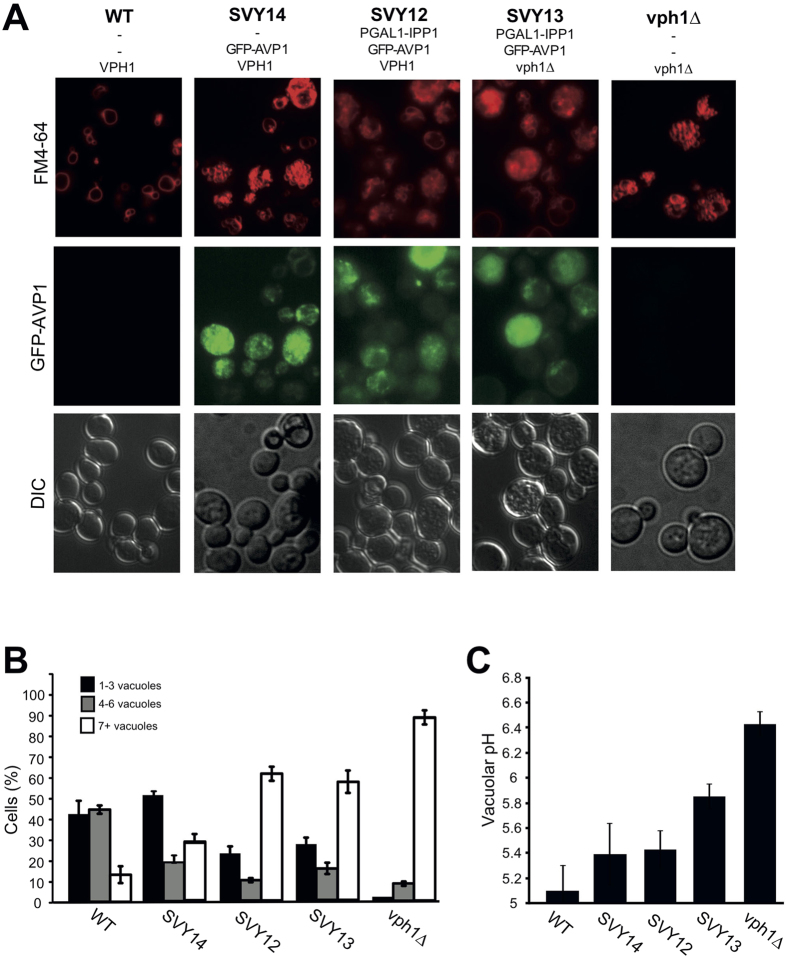
Figure 7. Effect of GFP-AVP1 expression on vacuolar structure and pH.
(A) Vacuolar morphology. V-ATPase proficient cells (BY4741) or vph1Δ cells, and cells expressing GPF-AVP1 in these backgrounds (SVY12, SVY13, SVY14), were grown at pH 5.5 to logarithmic phase, stained with FM4-64, and analyzed by spinning disc fluorescence microscopy. (B) Classification of the cells shown in panel A according to the number of vacuoles per cell. 200–400 cells were analyzed per strain (n = 3–5). (C) Vacuolar pH was measured for the cells used in (A). (n = 7–9).

