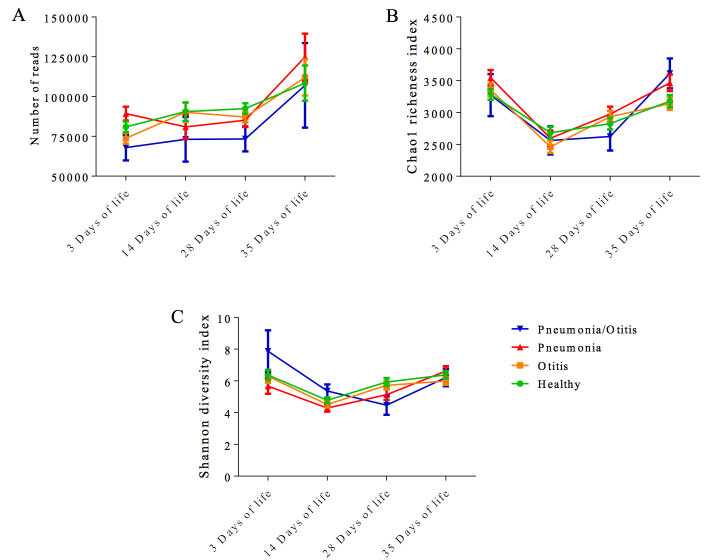
Figure 1.
Bar graphs illustrating the number of reads (A), Chao 1 richness index (B) and Shannon diversity index (C) for different postnatal ages. Error bars represent standard errors. Dunnett’s multiple comparison procedure was used to compare each disease status (otitis, pneumonia, and pneumonia-otitis combined) against the status “healthy” within each sample collection date.

