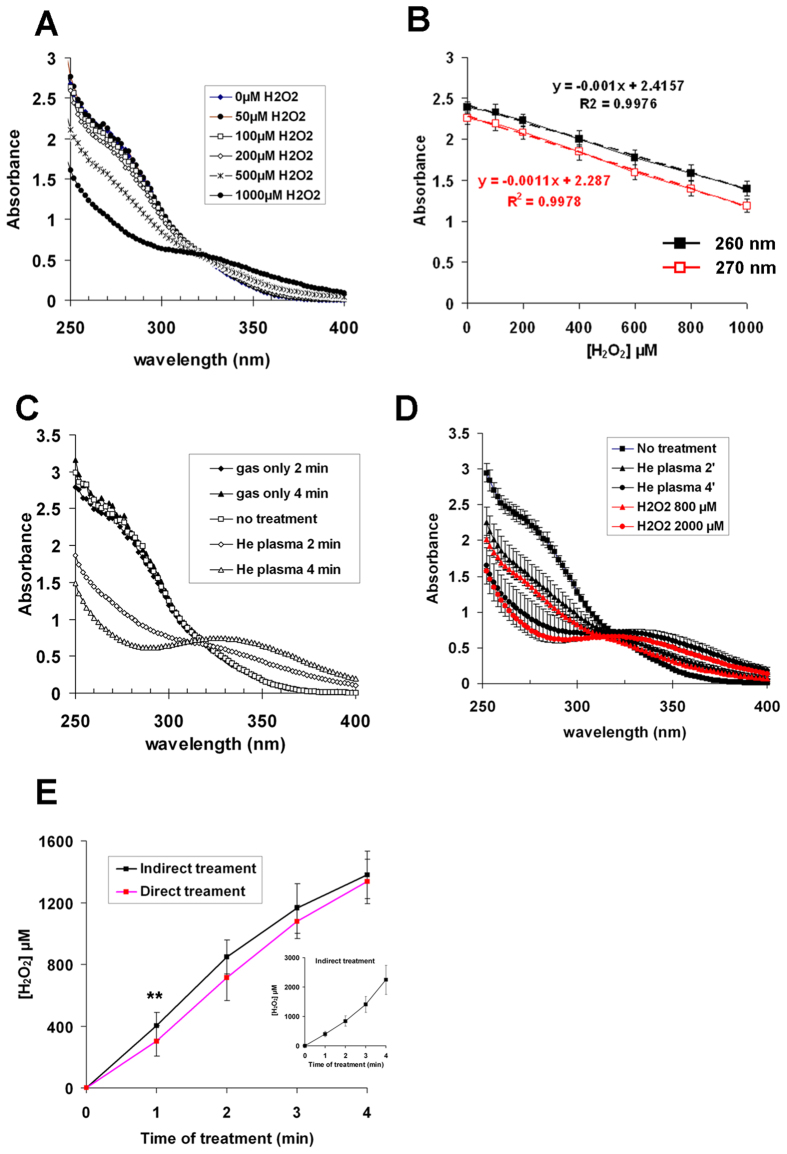
Figure 2. Quantification of H2O2 produced in PBS(Ca2+/Mg2+) by He plasma.
(A) Absorption spectra between 250 and 400 nm of 1 mM Na3VO4 solutions in PBS(Ca2+/Mg2+) and incubated with increasing concentration of H2O2. (B) Correlation between the change in the optical density at 260 nm and 270 nm of 1 mM Na3VO4 solutions and the concentration of H2O2. The data are the mean ± sd of 12 independent experiments. The equations and correlation coefficients in black and red were derived from the linear regression of the values at 260 and 270 nm, respectively. (C) Absorption spectra between 250 and 400 nm of 1 mM Na3VO4 solutions in PBS(Ca2+/Mg2+) exposed to He gas or He plasma for 2 and 4 min. (D) Comparison between the absorption spectra of H2O2 solutions at 800 μM and 2 mM and the absorption spectra of plasma-activated PBS(Ca2+/Mg2+) after 2 and 4 min of treatment. The spectra are the average ± SD of 3 independent experiments. (E) Solutions of PBS(Ca2+/Mg2+) containing (direct treatment) or not (indirect treatment) 1 mM Na3VO4 were exposed to He plasma for 1, 2, 3, or 4 min. For indirect treatment, Na3VO4 was then added to plasma-treated PBS. The optical density of each solution was recorded at 260 and 270 nm, and the concentration of H2O2 determined using equations shown in panel B. The data are the mean ± SD of 12 independent experiments (t-test **p < 0.01). Insert: Solutions of PBS(Ca2+/Mg2+) were exposed to He plasma and were diluted 2x, 4x and 8x before adding Na3VO4. The concentration of H2O2 in each solution was determined as mentioned above by taking into account the dilution factors. The data are the mean ± SD of 9 independent experiments. For the experiments described in the panels C, D, E and F, the He flow was set to 50 sccm and the output voltage to 8 kV.

