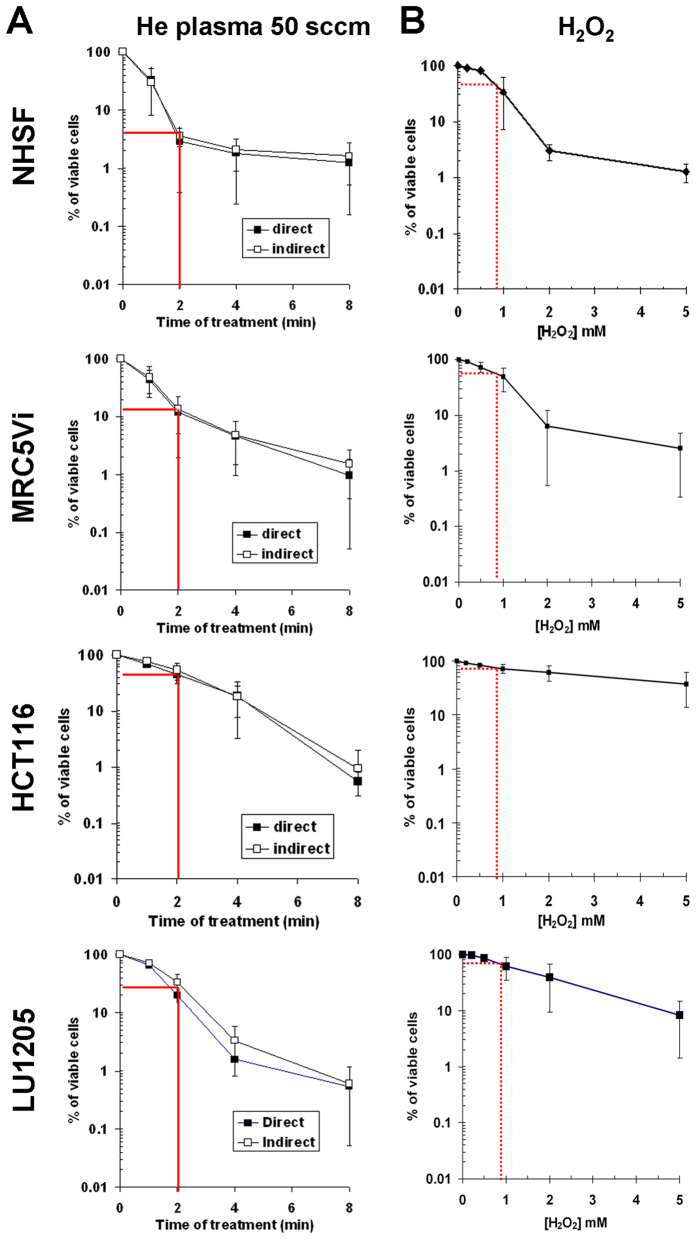
Figure 5. The concentration of plasma-induced H2O2 in PBS(Ca2+/Mg2+) does not fully explain the sensitivity of cells to He plasma.
(A) Normal (MRC5Vi and NHSF) and tumour cells (HCT116 and Lu1205) were exposed in PBS(Ca2+/Mg2+) to He plasma (direct treatment) or to plasma-activated PBS(Ca2+/Mg2+) (indirect treatment) for 1, 2, 4 and 8 min, as described in Material and Methods. The He flow was set to 50 sccm and the output voltage to 8 kV. (B) The same cells were exposed to increasing concentration of H2O2 in PBS(Ca2+/Mg2+). The cell viability assay was performed 24 h post treatment. The data are the average ± SD of 3 to 4 independent experiments (He plasma treatment, t-test p > 0.05) and 5 to 8 independent experiments (H2O2 treatment). The continuous and dashed red lines indicate the percentage of viable cells after 2 min of He plasma treatment and after 800 μM of H2O2, respectively.

