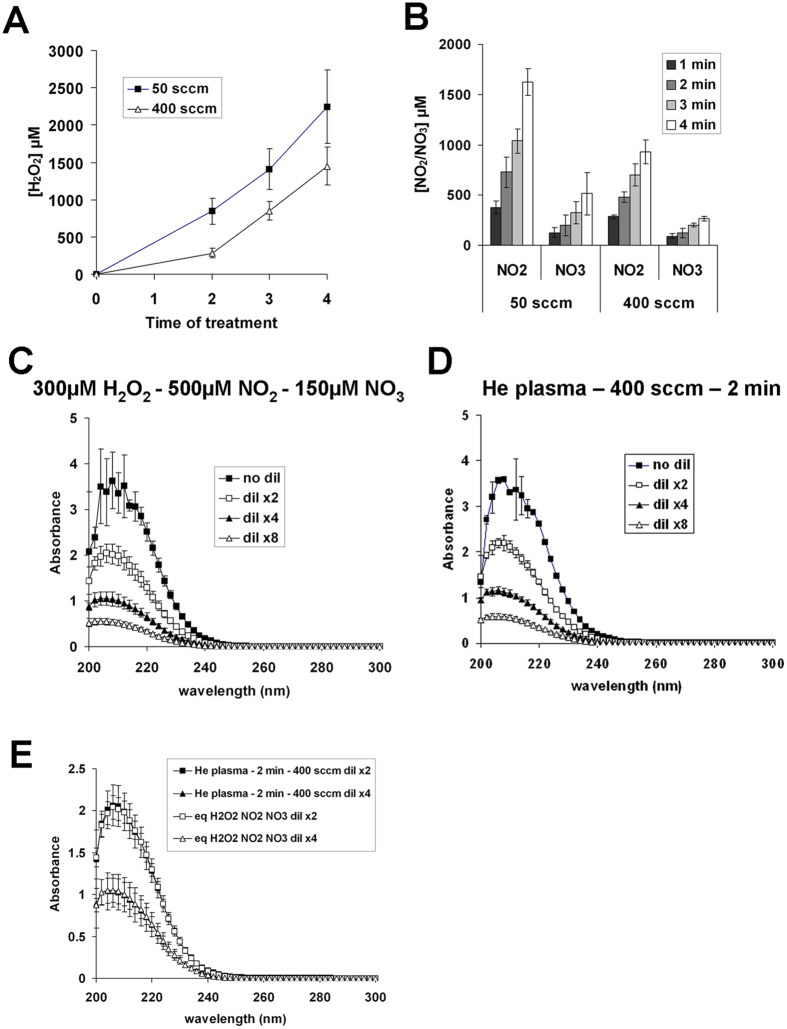
Figure 6. Increasing the He flow decreases the concentration of plasma-induced H2O2, NO2− and NO3−.
500 μl of PBS(Ca2+/Mg2+) per well in 12 well plate were exposed to 50 or 400 sccm of He plasma for 1, 2 and 4 min. The concentration of H2O2 (A) and NO2/NO3 (B) were determined using the Na3VO4-based method and the nitrate/nitrite colorimetric assay kit, respectively. The data are the mean ± SD of 5 (H2O2) and 4 (NO3− and NO2−) independent experiments. (C) Absorption spectra of a mixture of 300 μM H2O2, 500 μM NO2− and 150 μM NO3− prepared in PBS(Ca2+/Mg2+). The data are the mean ± SD of 4 independent experiments. (D) 500 μl of PBS(Ca2+/Mg2+) were exposed to He plasma at a flow rate of 400 sccm for 2 min, and the absorption spectra were recorded between 200 and 300 nm. The data are the mean ± SD of 3 independent experiments. (E) Comparison between the absorption spectra of a mixture of 300 μM H2O2, 500 μM NO2− and 150 μM NO3− (curves shown in panel C) and the absorption spectra of plasma-activated PBS(Ca2+/Mg2+) (curves shown in panel D). As indicated in the panels C, D, and E, the solutions containing H2O2, NO2− and NO3− or plasma-activated PBS(Ca2+/Mg2+) were diluted 2x, 4x, or 8x in PBS(Ca2+/Mg2+) before the spectroscopic measurements.

