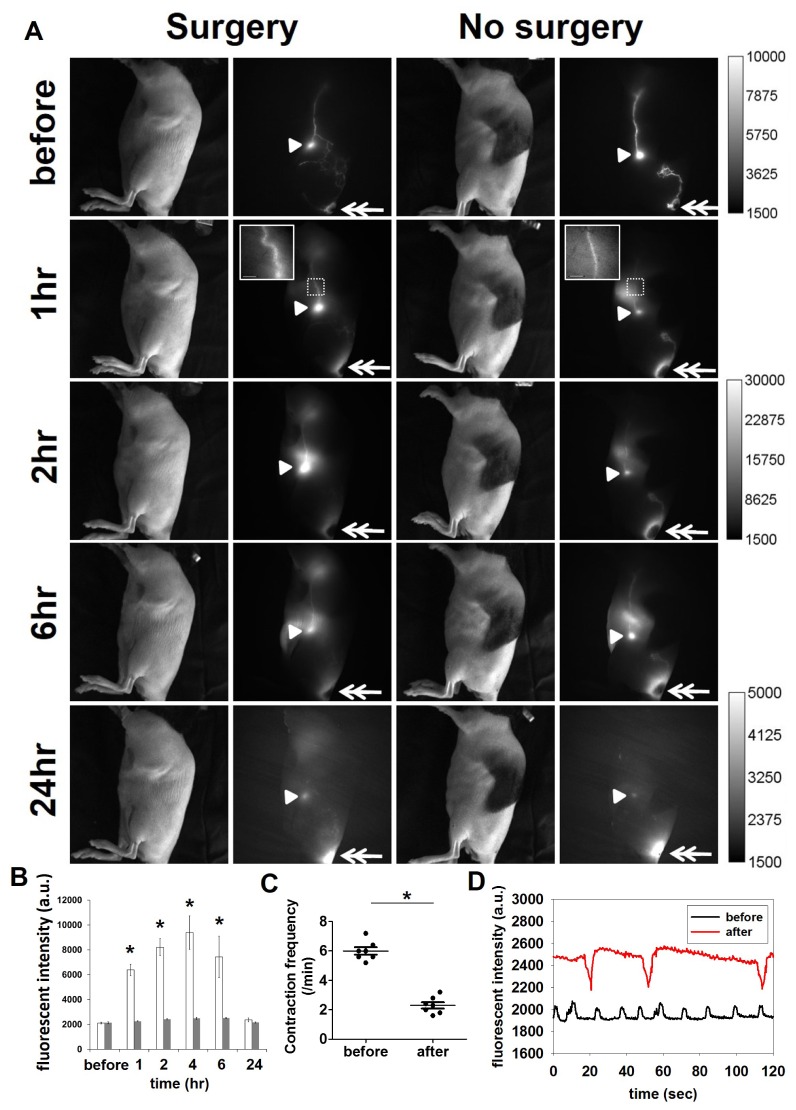
Fig. 5.
A. White light and fluorescent images in the left lateral side of mice prior to and 1, 2, 6, and 24 hrs after ALN removal, following i.d. injection of ICG to the base of the tail. Double arrow, ICG injection site. Arrow head, ILN. Inset, magnified image of the white rectangle region. Scale, 1 mm. B. The fluorescent intensities in the axillary region in mice (white) before and up to 24 hrs after axillary lymphadenectomy and mice with no surgery (grey). * p < 0.05 vs. non-surgery mice (n = 7/group). C. The lymphatic contraction frequency in the internodal collecting lymphatic vessels before and 10 mins after surgery. D. Representative image demonstrating lymphatic vessel contraction (before, black; after, red). * p < 0.05.

