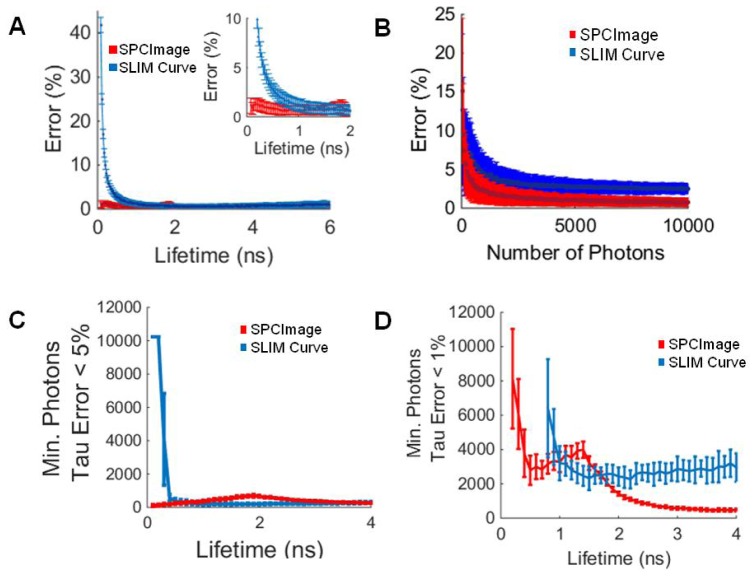
Fig. 1.
(A) Percent error of the SPCImage and SLIM Curve calculated lifetime values for a single-exponential decay, insert shows errors for lifetimes less than 2 ns. (B) Error in calculated lifetime of SPCImage and SLIM Curve for single component lifetime decays where τ = 0.6 ns. (C) Minimum number of photons for SPCImage and SLIM Curve to calculate the lifetime of a single-exponential decay within 5%. (D) Minimum number of photons for SPCImage and SLIM Curve to calculate the lifetime of a single-exponential decay within 1%. Mean +/− SD (256 simulations).

