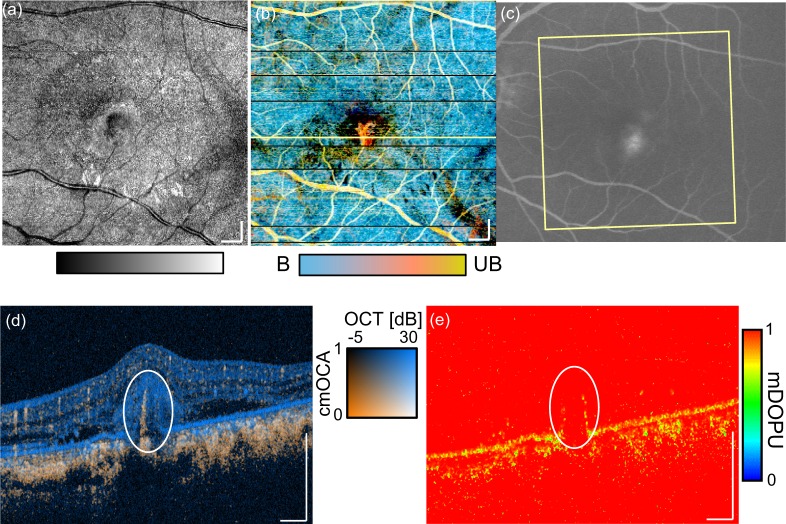
Fig. 9.
cmOCA images of polypoidal choroidal vasculopathy. En-face (a) OCT, (b) composition of cmOCA and mDOPU projection images. The scanning area is 6 × 6 mm2. The corresponding area is indicated by the yellow rectangle in fluorescein angiography (c). The cross-sectional (d) OCT + cmOCA and (e) mDOPU images at the center of the scan [yellow line in (b)] are shown. The scale bar indicates 500 μm.

