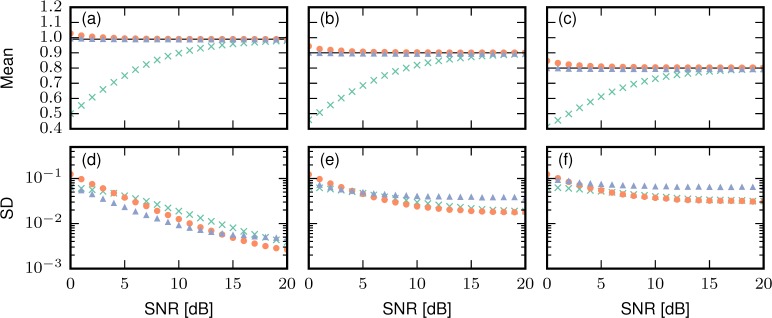
Fig. 10.
The numerical simulation results of correlation coefficient estimates. (a, b, c) Mean and (d, e, f) standard deviation of each correlation estimator, i.e., data correlation (×), signal correlation with previous method using coherent composite (▲), and the new method (●) are plotted with several SNR. The set correlation coefficients are (a, d) 0.99, (b, e) 0.9, and (c, f) 0.8.

