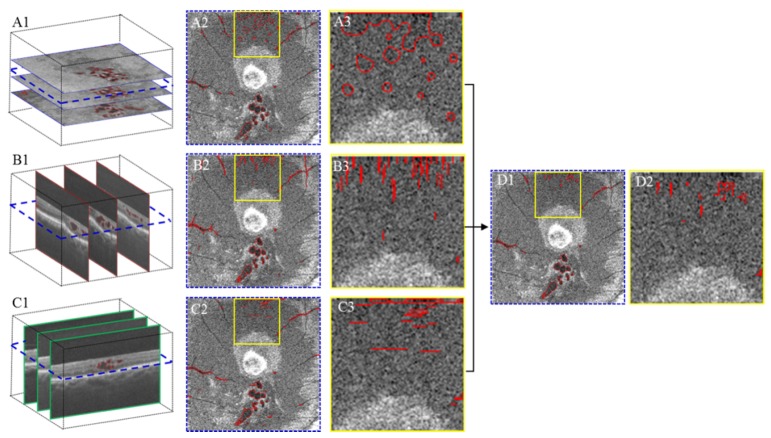
Fig. 5.
Illustration of improving retinal fluid segmentation accuracy by voting of cross-sectional segmentations. (A1) (B1) and (C1) are the segmentation results obtained by applying the fuzzy level-set method on C-scan and two B-scans, respectively. (A2) (B2) and (C2) are the segmentation results represented on a C-scan extracted from (A1) (B1) and (C1). (A3) (B3) and (C3) show a zoomed in perspective of the yellow square region in (A2) (B2) and (C2). (D1) is the segmentation result after voting. (D2) shows a zoomed in perspective of the yellow square region in D1. It can be seen that D2 has much less error than (A3) (B3) and (C3).

