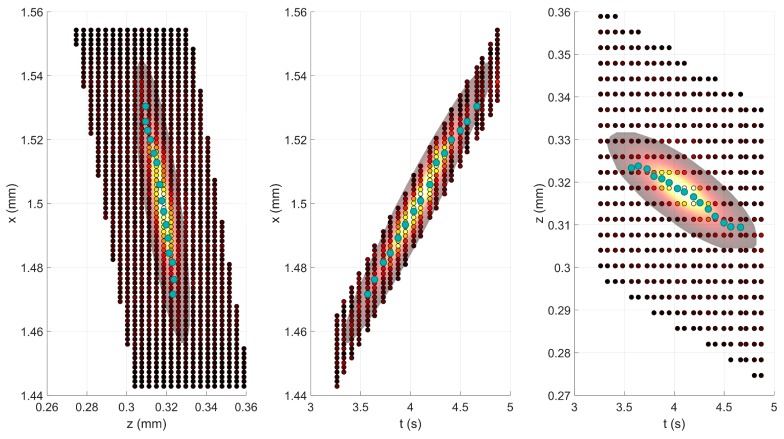
Fig. 3.
A sample streak fit. The three panels show the three possible 2D projections from the 3D streak (x-z, x-t, and z-t). The smaller, background circles are the image pixels, whose color represents the pixel intensity. As such, the yellow-white circles are where the streak is located. The large region around the streak was the region over which the fitting was done; the orientation of this region is derived from PCA. The fit itself is the continuous region in the background. The turquoise circles represent particle tracking based on center of mass per frame.

