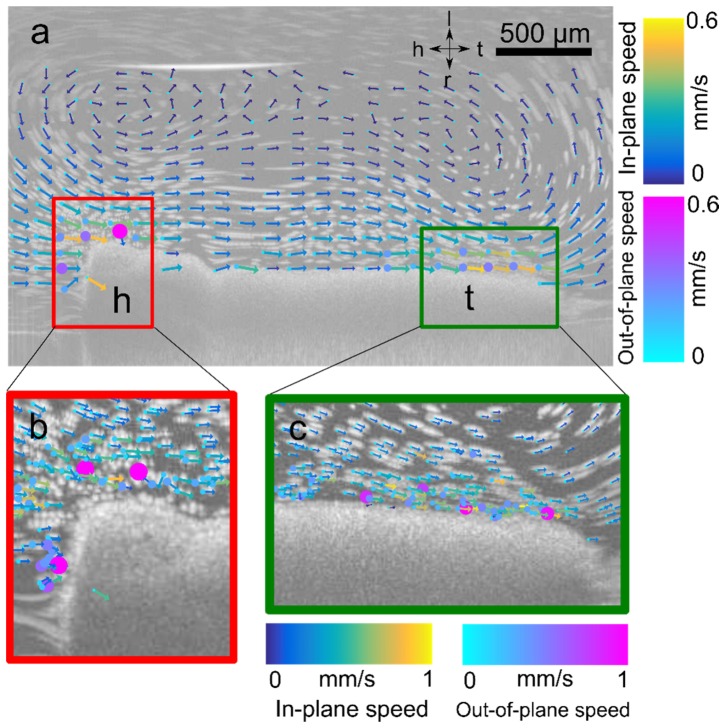
Fig. 5.
Quantification of cilia-driven flow in X. tropicalis tadpole epithelium. (a) Maximum intensity projection image showing streaks traced out by particles, with primary direction of flow from head (h) to tail (t). Overlay of vector flow field estimated with PSV-OCT showing in-plane velocity (vx,vz) and direction indicated by length and direction of arrow, and out-of-plane speed |vy| indicated by size and color of circle placed at base of each arrow. Axes: h- head; t- tail; l-left, r-right. (b,c) inset of location of region of higher out-of-plane flow near the (a) head of the embryo and (b) tail of the embryo.

