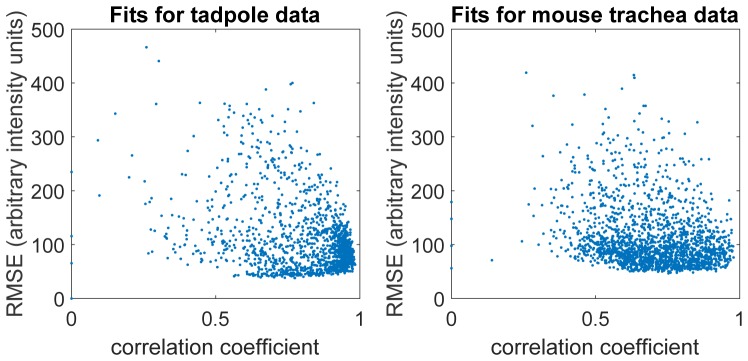
Fig. 7.
The correlation coefficients and root mean-square errors (with arbitrary intensity units) of all streak fits (prior to any goodness-of-fit filtering) for the tadpole data and the mouse trachea data. Ideally, the fits will be of low mean-square error and correlation coefficients close to 1. It is thus reassuring that the points in the figure are clustered close to the lower right corner.

