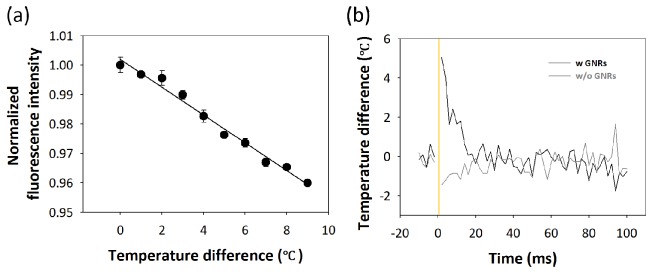
Fig. 7.
Characterization of local heat generation by GNRs. (a) Temperature dependence of fluorescent intensity of biotinylated FITC shows a linear decrement of normalized fluorescent intensity upon temperature increment. (b) Temperature profiles are measured from temperature-sensitive fluorescent dyes before and after illuminating laser (indicated by yellow line) in solutions with and without GNRs. Temperature is monitored by capturing average fluorescent intensity with a frequency of 500 Hz.

