
Figure 2.
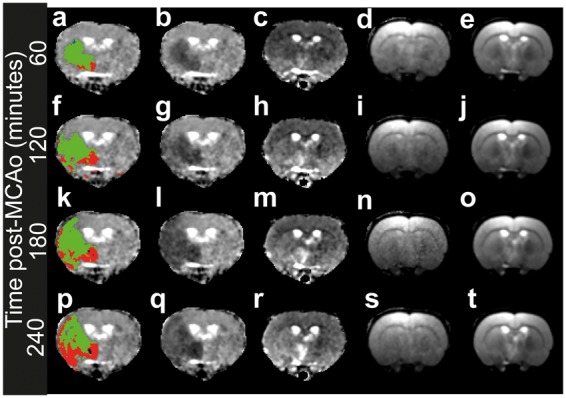
Example of lesion detection and T2 segmentation over time in rat brain. The MRI data in rows were recorded at different time points, whilst columns are different image types. Row 1 (a–e), 60 min post-MCAO, row 2 (f–j), 120 min post-MCAO, row 3 (k–o) 180 min post-MCAO, row 4 (p–t) 240 min post-MCAO. The first column shows the ADC map with the lesion shown. Green denotes regions with “normal” T2, red with elevated T2, blue (apparent only in a) reduced T2 (see text). Column 2 shows the ADC map alone, column 3 shows the T2 map, column 4 the I(0) map from T2 fitting, and column 5 the T2-weighted images.