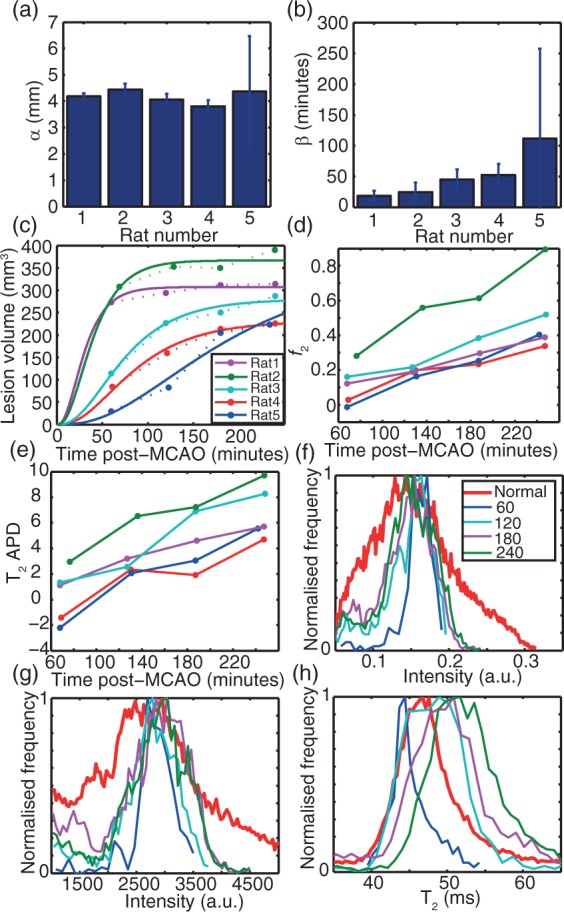
Figure 3.

Time dependence of MRI parameters relating to ischaemia in rat MCAo. (a–e) findings for all animals; (f–h) detailed findings for a typical animal (Rat 3, f–h all use the legend as in f). (a,b) Fitted effective lesion radii and time constants, respectively, using equation (16), showing 95% confidence intervals on fitted parameters; (c) lesion volume by automated detection including the fit using the parameters in (a and b) and equation (16). Solid lines indicate the fit, dotted lines connect points for visual guidance; (d) f2 for all animals plotted separately; (e) absolute percentage difference (APD) for T2 between lesion and non-lesion for all animals. Panels (c) to (e) share the legend shown in (c). (f) In a typical animal, the distribution of I(0) derived from T2 fitting as a function of time; (g) Echo-summed T2-weighted signal intensities obtained by summing all 12 echoes with TEs ranging from 10 ms to 120 ms; (h) absolute T2 distribution. In (f) to (h), the “normal” reference histogram (red) is derived from all non-lesion voxels for the 60-min post-MCAO scan.
