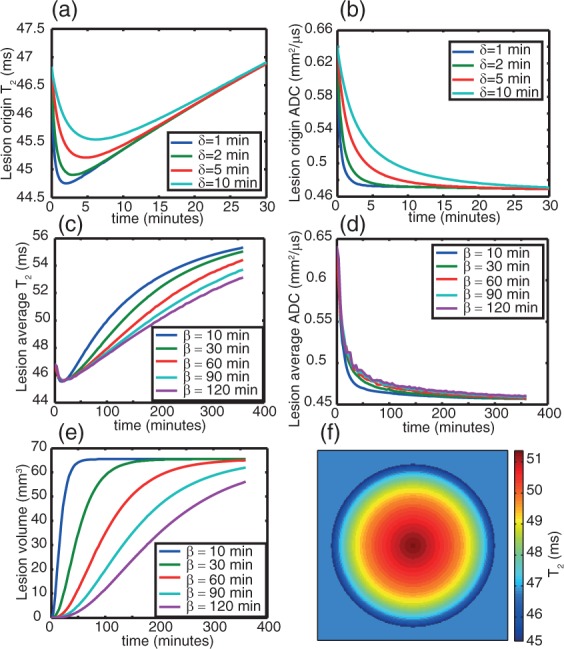
Figure 4.

Simulation of the time-course of T2 and ADC using the CED model. Panels (a) and (b) show the early time dependence of T2 (a) and ADC (b) respectively, demonstrating different behaviour for different oedema timescales (given by δ). Panels (c) and (d) shows T2 (c) and ADC (d) kinetics over a longer timescale, for a fixed value of δ = 2 min but different values of β (the lesion growth coefficient), which is the main determinant of T2 and ADC kinetics after 30 min. Panel (e) shows the lesion volume kinetics for different β values; panel (f) shows the heterogeneity of T2 within a simulated circular lesion 2 h after onset at β = 60 min.
