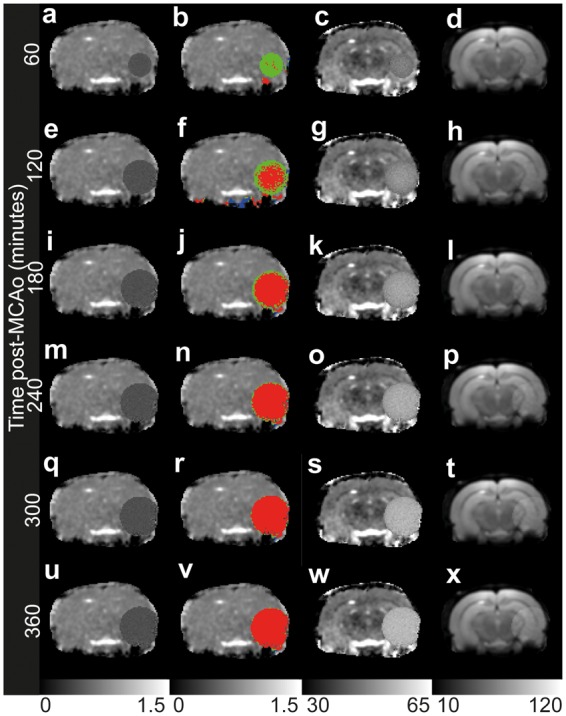
Figure 5.

Lesions simulated in diffusion-weighted and T2-weighted data from a control rat and detected using the automated procedure given in the Methods section at different times post-onset. Panels (a, e, i, m, q, u): ADC maps with scale bar in mm2/µs. Panels (b, f, j, n, r, v): ADC maps with automatically detected lesions, coloured by proximity of T2 to healthy values (for details see Figure 1 legend) with scale bar in mm2/µs. Panels (c, g, l, o, s, w): T2 maps with scale bar in ms. Panels (d, h, k, p, t, x): T2-weighted maps at a TE of 50 ms, calculated as the optimum TE, with scale bar in arbitrary units.
