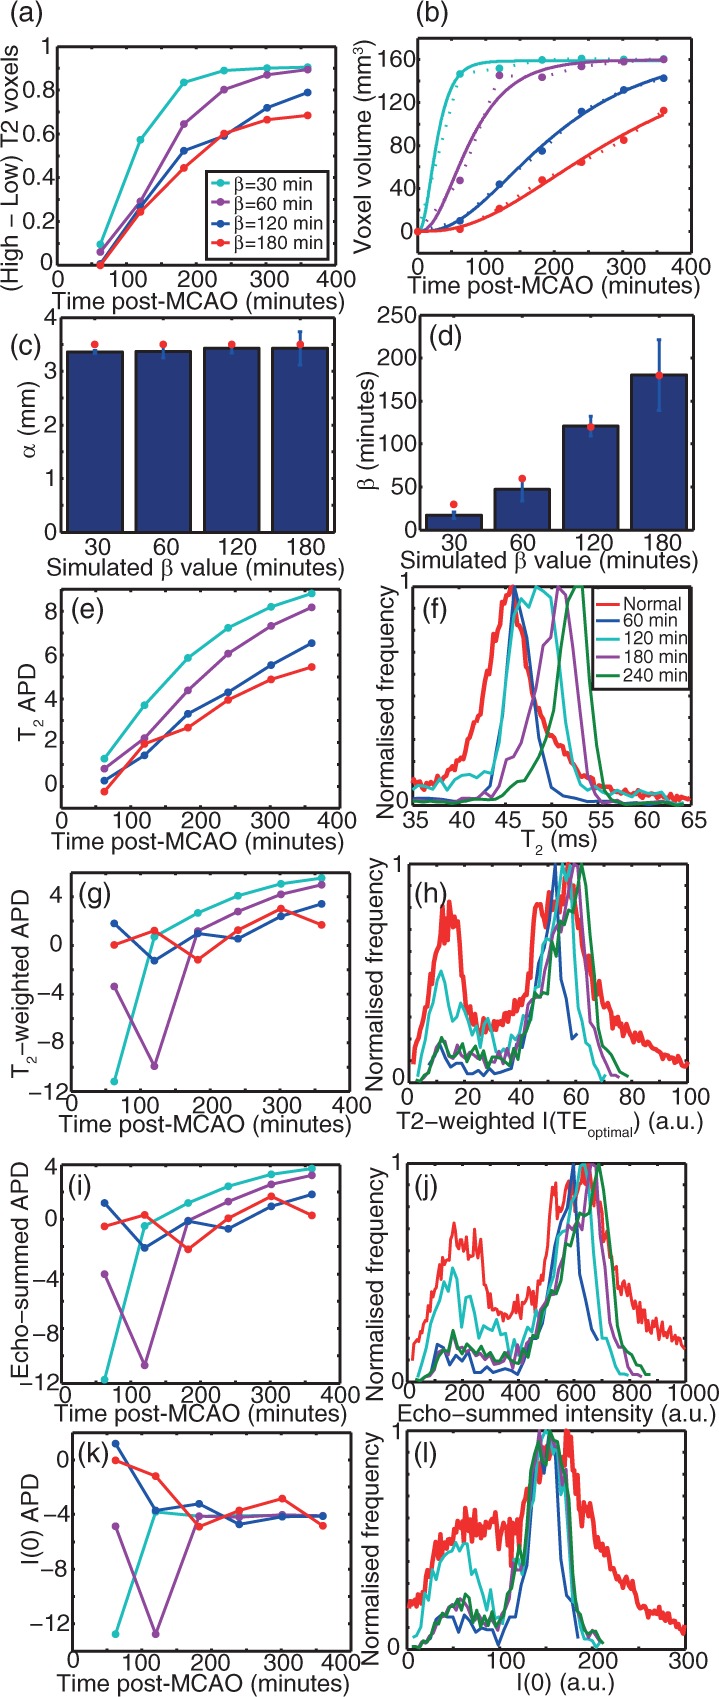
Figure 6.

Time-dependence of MR parameters in lesions simulated in otherwise experimental data detected automatically using the criteria given in the Methods section, as a function of post-MCAO time and the lesion progression time coefficient β. (a): f2. (b) Lesion volume including the fit using equation (16) shown in solid lines. Dotted lines connect points as a visual guide. (c) and (d) α and β parameters, respectively, fitted to the extracted lesions from the simulated data using the automated procedure. (e) APD between the detected lesion and non-lesion T2. (f) Using β = 60 min, T2 histograms are plotted as a function of post-MCAO (onset) time. (g) and (h) APD between the detected lesion and non-lesion T2-weighted intensity at the optimum TE of 50 ms and T2-weighted intensity histograms for β = 60 min, respectively. (i) and (j) APD between the detected lesion and non-lesion echo-summed T2-weighted signal intensities and histograms of echo-summed T2-weighted signal intensities for β = 60 min, respectively. Panels (k) and (l) show the APD between the detected lesion and non-lesion I(0) (as determined from T2 fitting) and I(0) histograms for β = 60 min, respectively. Panels (a, b, c, e, g, i, k) share the legend shown in panel (a). Panels (f, h, j, l) share the legend shown in panel (f).
