Figure 1.
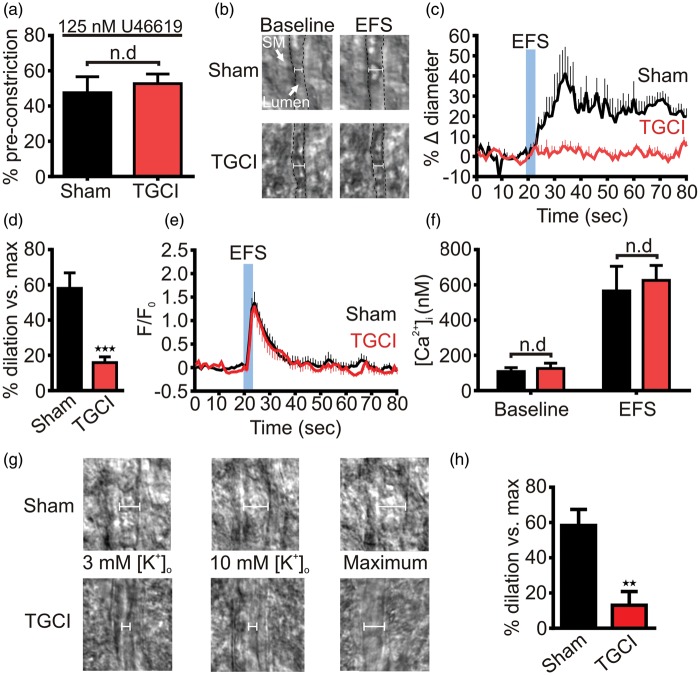
Transient global cerebral ischemia disrupts K+-mediated neurovascular coupling in brain slices. (a) U46619 (125 nM) evoked the same degree of constriction in rat parenchymal arterioles in brain slices from sham (48% ± 9%; n = 5) and ischemic rats (53% ± 5%; n = 5). This maneuver simulates basal myogenic tone in the absence of intravascular pressure. (b) EFS evoked substantial arteriolar dilation in brain slice arterioles from sham, but not TGCI, rats. Lumen edges are indicated by the dashed black line. SM: smooth muscle. (c) Averaged time-courses showing brain slice arteriolar diameters before and after EFS. In sham rats (n = 7) EFS produced robust vasodilations, whereas after TGCI (n = 8) this response was absent; 10 animals were used for each group, the lower n numbers reported reflect attrition from unsuccessful experimental preparations. (d) Summary dilations indicating the vasodilation relative to passive diameter of the arteriole. Peak dilations were substantially blunted by TGCI. ***P < 0.001, Student’s unpaired t-test. (e) In contrast, the fractional change in astrocytic endfoot Fluo-4 fluorescence evoked by EFS was not different after TGCI (n = 16) compared to sham (n = 14). Here, 16 animals were used for each group, with lower n numbers reflecting attrition from unsuccessful preparations. (f) Similarly, the estimated endfoot baseline (sham: 108 ± 22 nM, n = 7; TGCI: 126 ± 30 nM, n = 6) and EFS-evoked (sham: 566 ± 140 nM, n = 7; TGCI: 626 ± 84 nM, n = 6) Ca2+ responses were unaffected by TGCI. (g) Typical images obtained during experiments in which bath K+ was raised to 10 mM to stimulate KIR channel-mediated dilations. While this produced robust dilation of arterioles in sham brain slices (top), in TGCI slices arteriolar diameter was unaffected (bottom). (h) Summary of 10 mM K+-evoked increases in diameter. Peak dilations produced by this maneuver were significantly lower in slices from TGCI rats (13 ± 8 %, n = 6; compared to sham: 58 ± 9 %, n = 6). **P = 0.004, Student’s unpaired t-test.

