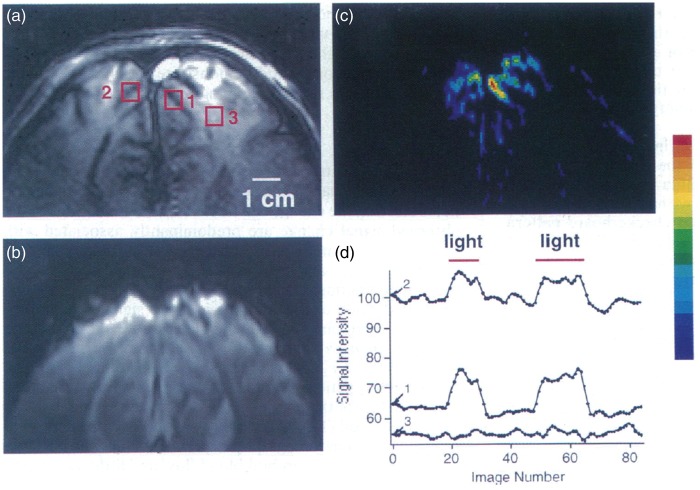
Figure 2.
Early demonstration of the BOLD effect in humans. (a) T1-weighted axial image with several regions of interest (ROIs) indicated by square boxes; (b) T2*-weighted BOLD image at the same slice location; (c) Pseudo-color map of BOLD image intensity changes in response to visual stimulation and (d) corresponding time-course plots of signal intensities from ROIs in (a), indicating restriction of BOLD effect to ROIs (1 and 2) in the visual cortex. Reproduced from Ogawa et al.,19 with permission.

