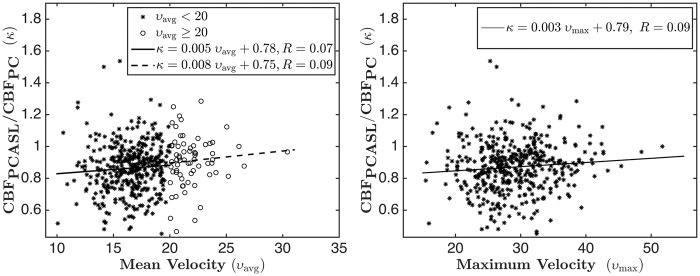
Figure 6.
(Left subplot) Scatter plot of the ratio of CBFPCASL and CBFPC with respect to mean flow velocity. The asterisks corresponds to υ < 20 cm/s and the circles correspond to υ > 20 cm/s. The solid and the dotted lines show fits corresponding to υ < 20 cm/s and υ > 20 cm/s, respectively. The fit corresponding to the complete data set is κ = 0.007 υ + 0.75, R = 0.13. (Right subplot) Scatter plot of the ratio of the CBF PCASL and CBFPC with respect to maximum flow velocity; the line shows fit for the complete data set.

