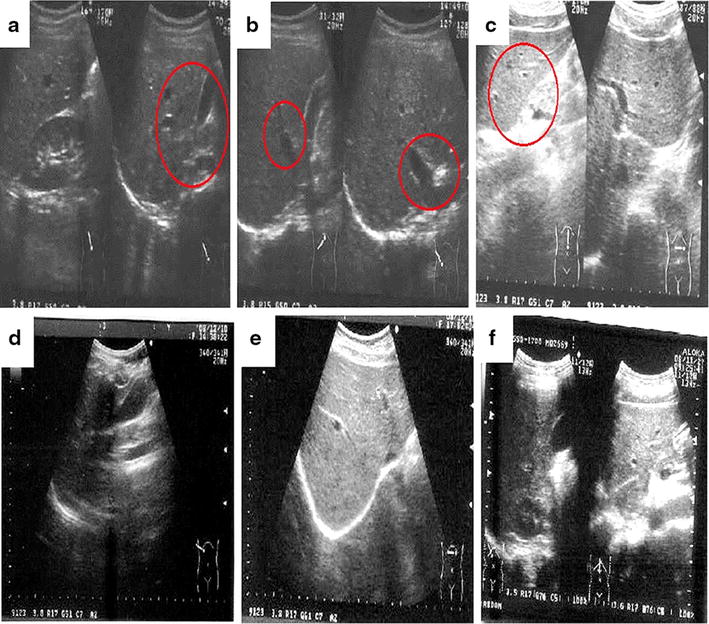
Fig. 2.

The Abdominal ultrasonic image of SWT treated healthy participants. a–c represented participant no. 3, 9 and 28 at baseline with mild fatty liver, gall bladder stone and splenomegaly respectively (indicated with arrow mark). d–f represents participant no. 3, 9 and 28 at 6th month of SWT treatment with normal inference (no signs of fatty liver, gall bladder stone and splenomegaly)
