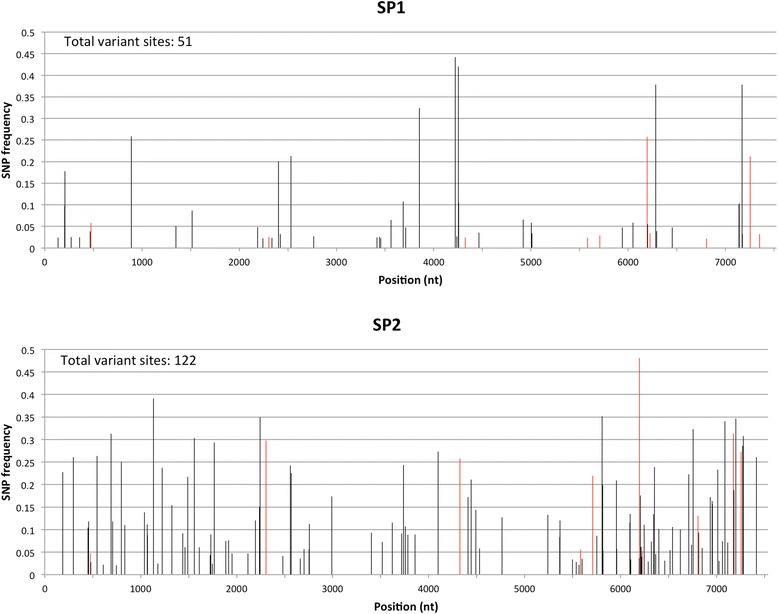
Fig. 2.

Distribution of NoV SNV frequencies across the viral genome. Samples SP1 and SP2 were collected four months apart from an immunocompromised bone marrow transplant patient with chronic NoV infection. SNV calling was performed using Freebayes. Only SNVs with frequencies ≥ 2 % and ≥ 5X coverage are reported. Positions with coverage < 10X were excluded from the analysis. SNVs shared in common between SP1 and SP2 are shown in red
