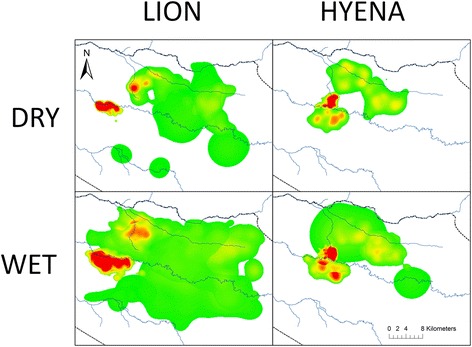
Fig. 3.

Seasonal landscape-level 95 % utilization distributions (UDs) for lions and hyenas. Serengeti National Park boundary is shown as a thick black and white line and permanent rivers as blue lines. UDs transition from low use (green) to high use (red). Lion dry season UD (top left) represents 7983 relocations from 5 lions in 4 prides; lion wet season UD (bottom left) represents 19164 relocations from 6 lions in 5 prides; hyena dry season UD (top right) represents 4328 relocations from 4 hyenas in 4 clans; and hyena wet season UD (bottom right) represents 9669 relocations of 5 hyenas from 5 clans
