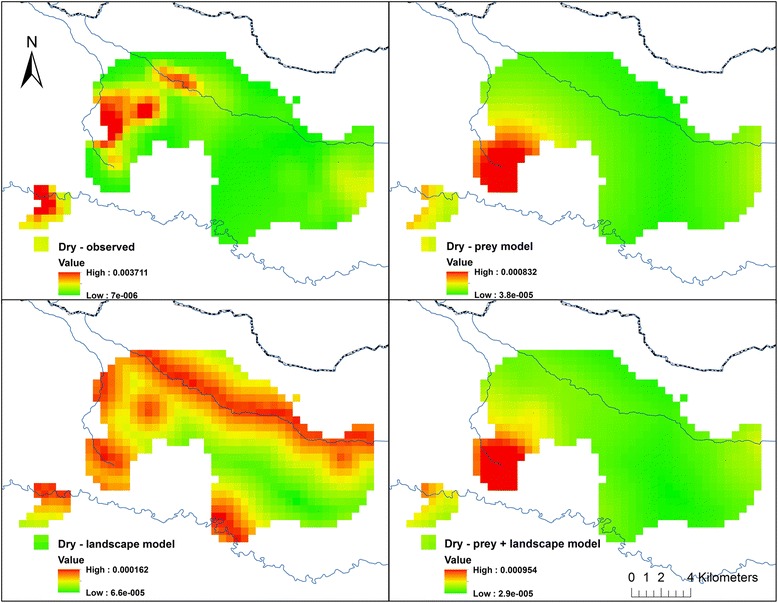
Fig. 4.

Observed and model-projected dry season lion utilization distributions in Serengeti National Park’s western corridor. Top left shows observed lion use; top right shows lion use projected from the prey availability model; bottom left shows lion use projected from the landscape attributes model; and bottom right shows lion use projected from the prey availability + landscape attribute model. Dark line at top is the National Park boundary and blue lines are permanent rivers. Displayed lion UDs are only those portions of total lion ranges that overlap hyena UDs
