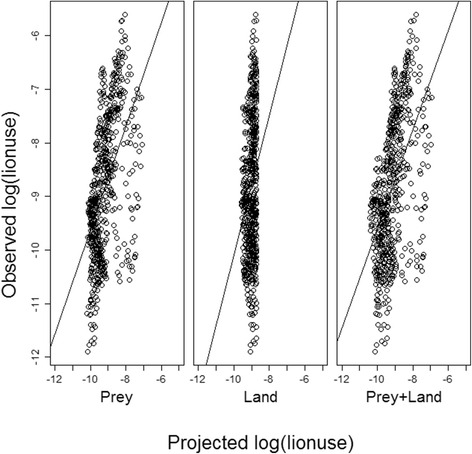
Fig. 5.

Correlation between observed and projected dry season lion use. Correlation between log of observed lion dry season space use (i.e. the probability of occupancy of a quadrat) and (left) log of prey availability model-projected dry season lion space use (|r| = 0.33); (middle) log of landscape attribute model-projected dry season lion space use (|r| = 0.26); and (right) log of prey availability + landscape attribute model-projected dry season lion space use (|r| = 0.35)
