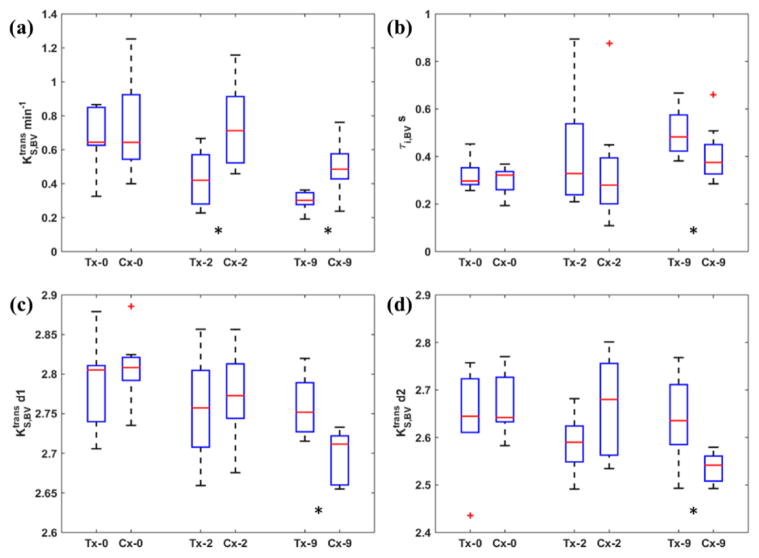
Figure 7.
Comparisons of mean (a), mean τi,BV (b), d1 (c) and d2 (d) at three treatment days. Tx = treatment group; Cx = control group. The red horizontal line indicates the median value and the whiskers indicate ± 1.5 interquartile range (IQR). At Day2, the treatment group had significantly lower (indicated by *) ; At Day9 the treatment group had significantly lower (indicated by *) , τi,BV and d1 and d2 values

