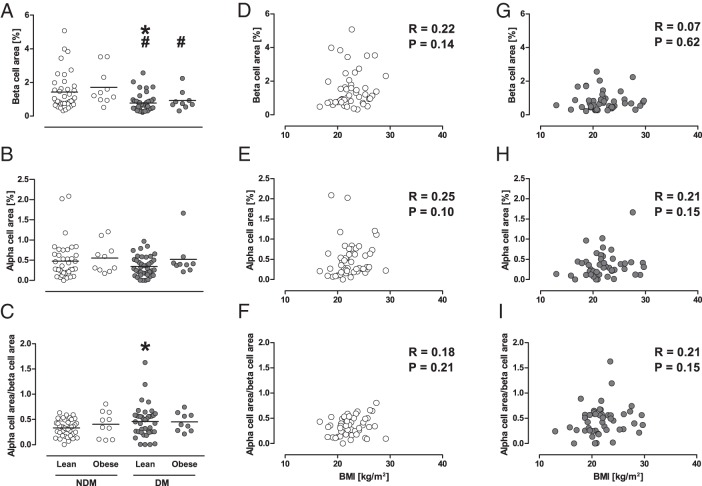
Figure 2.
A–C, Effects of obesity on BCA, ACA, and ACA to BCA ratio in cases with and without diabetes. Gray and white circles show cases with and without diabetes, respectively. Bars indicate mean. *, P < .05 vs lean cases without diabetes; #, P < .05 vs obese cases without diabetes. D–I, Correlations between BMI and BCA, ACA, or ACA to BCA ratio in cases with and without diabetes.

