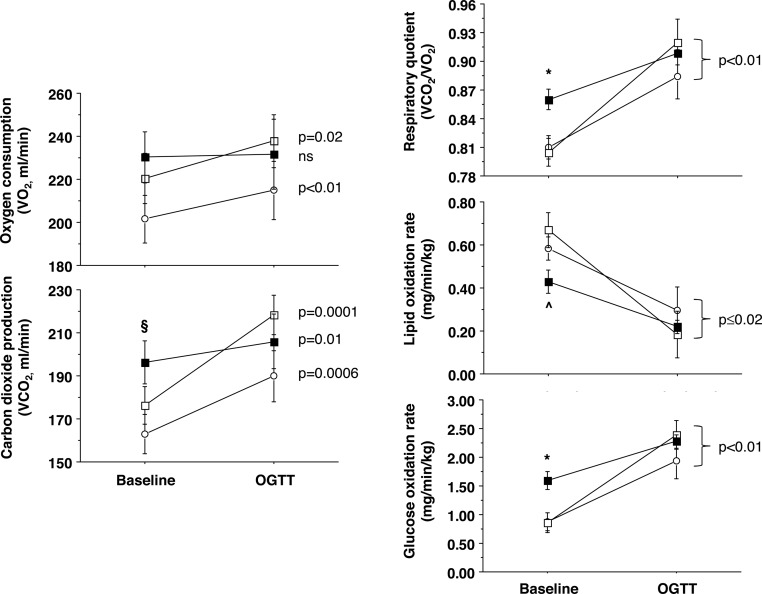
Figure 2.
Indirect calorimetry data showing raw gas fluxes (left) and derived values (right), including the respiratory quotient (top), lipid (middle), and glucose oxidative metabolism (bottom) in patients with ischemic CAD (closed squares, n = 7; fast, n = 5; OGTT), nonischemic CAD (open squares, n = 13; fast, n = 10; OGTT), and no-CAD (open circles, n = 7; fast, n = 7; OGTT). Symbols refer to cross-sectional comparisons (*, P < .05, ischemic CAD vs other groups; ∧, P < .05 ischemic vs nonischemic CAD; §, P = .03 ischemic CAD vs no-CAD group), whereas the P values reported on the right side of each graph refer to the change between the fasting and OGTT conditions. Data are expressed as mean and standard error.

