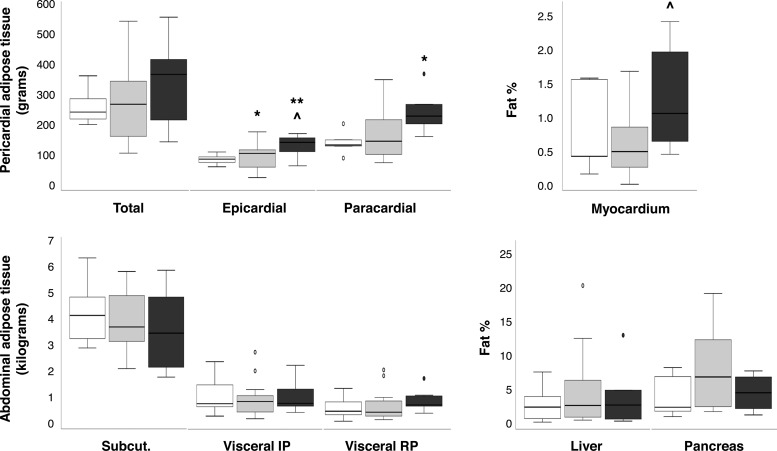
Figure 5.
Ectopic fat distribution, including pericardial (top left) and abdominal (bottom left) adipose depots, and triglyceride contents in the heart (top right), liver, and pancreas (bottom right), in ischemic CAD (black boxes; n = 5–8), nonischemic CAD (gray boxes; n = 8–13), and no-CAD (white boxes; n = 5–7) subjects. IP, intraperitoneal; RP, retroperitoneal. Circles on box plots represent outlier data with values between 1.5 and 3 times the interquartile range. *, P < .05; and **, P < .01 vs no-CAD subjects. ∧, P < .04 ischemic vs nonischemic CAD, analysis adjusted for usage of β-blockers and lipid-lowering medications.

