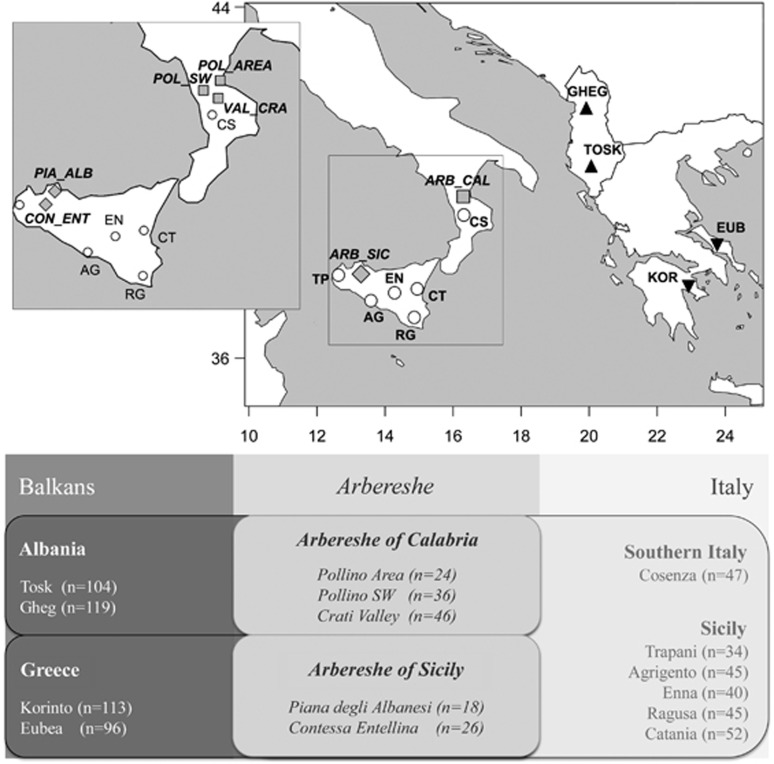
Figure 1.
Sampling map showing the location of Arbershe groups, Balkan source and Italian recipient populations. The enlarged box at the top-left details the communities decomposition for each of the two Arbereshe groups. The table at the bottom of the plot outlines the sampling structure and the number of samples analyzed for each population. Population codes as in Supplementary Table S1.

