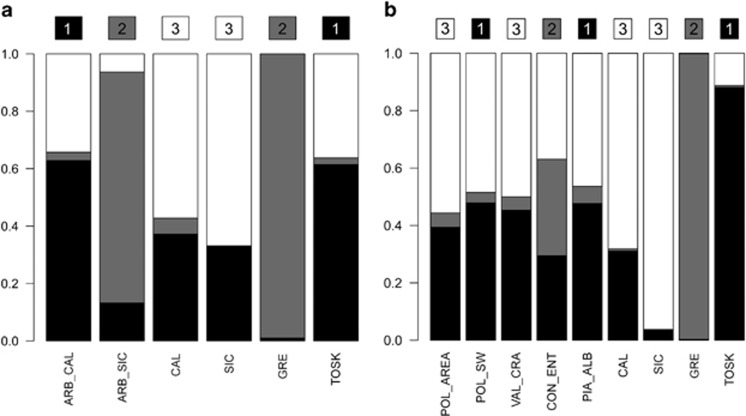
Figure 3.
Admixture-like barplots for the Arbereshe groups (a) and the single-Arbereshe communities (b). The inferred cluster affiliation of each population (mclust algorithm) and the corresponding cluster's color code (1: black; 2: gray; 3: white) are represented by numbers (within colored squares) at the top of each bar. The probability (DAPC-based posterior membership probabilities) of each population belonging to the inferred clusters is represented by vertical bars in the plot. Abbreviations: ARB_CAL, Arbereshe of Calabria; ARB_SIC, Arbereshe of Sicily; CAL, Italians of Calabria; SIC, Italians of Sicily; GRE, Greeks; TOSK, Tosks. Codes for single-Arbereshe communities as in Supplementary Table S1.

