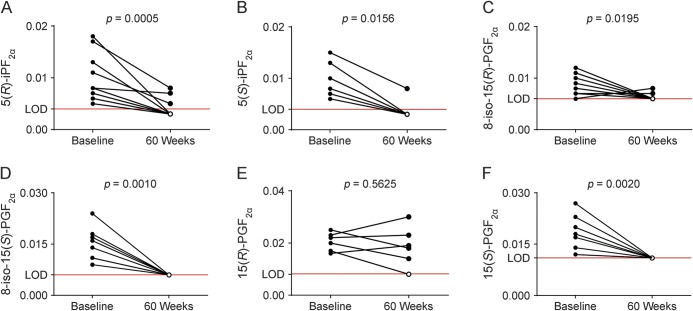
Figure 4. Natalizumab treatment decreases PGF2α in CSF of patients with secondary progressive MS and primary progressive MS.
Results are shown for the specific F2-IP 5-series: 5(R)-iPF2α (n = 12) (A) and 5(S)-iPF2α (n = 7) (B); and the 15-series: 8-iso-15(R)-PGF2α (n = 10) (C), 8-iso-15(S)-PGF2α (n = 11) (D), and 15(R)-PGF2α (n = 6) (E), as well as the enzymatic oxidation product 15(S)-PGF2α (n = 10) (F), respectively, before (baseline) and after treatment with natalizumab (60 weeks) with data expressed as ng/mL CSF. Data show results for individual participants and mean ± SEM. Open circle symbols represent values at or below detection limit. Dotted line represents the average LOD for each product. Statistical significance was determined by Wilcoxon matched-pairs signed rank test. LOD = limit of detection; MS = multiple sclerosis.

