Figure 1:

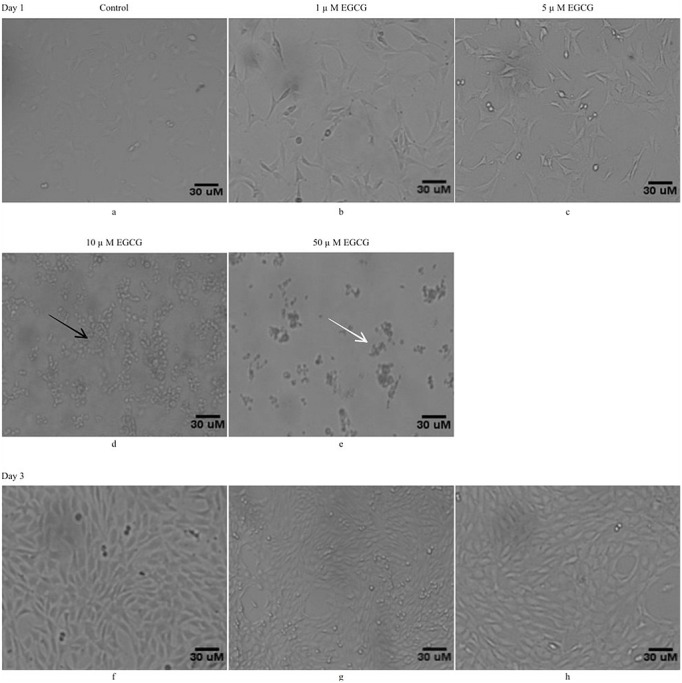
Low concentrations of EGCG treatment maintains for the cell viability: C3H10T1/2 cells were exposed to different concentrations of EGCG i.e. 1μM, 5μM 10μM, and 50μM EGCG. The morphology of the cells was observed under phase contrast microscopy (100 x). Photomicrographs a), b), c), d), & e) represents control cells, cells treated with1 μM, 5 μM, 10μM, & 50μM EGCG, respectively at day1 while f), g), & h) represent control cells and cells treated with 1 μM and 5 μM EGCG, respectively at day 3. Where ever shown, the black arrows represent cells undergoing shrinkage and white arrows represent cell detachment indicating toxicity to the cells. Since, the concentrations of EGCG at 1μM, 5μM are well tolerated by cells, these were allowed to grow continuously till day 3 (Figure g & h) without producing any toxicity in comparison to control cells (Figure f).
