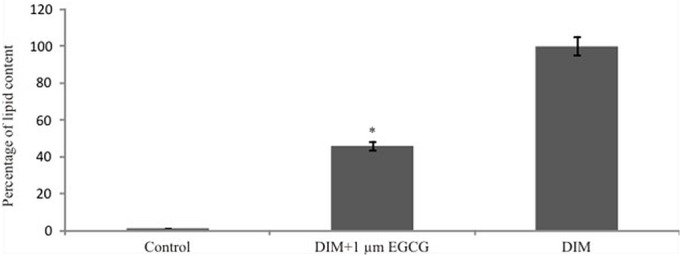
Figure 6:

Inhibition of Triglyceride content in adipogenic differentiating C3H10T1/2 cells by EGCG. Since the red stain of Oil red O is indicative of the triglyceride content, its levels were observed by taking absorbance at 510 nm. The EGCG treatment to the DIM exposed cells significantly reduced the absorbance of the extracted red color in comparison to the Cells exposed to DIM only. The values represent mean ± SEM for three independent experiments.
