
Figure 7:
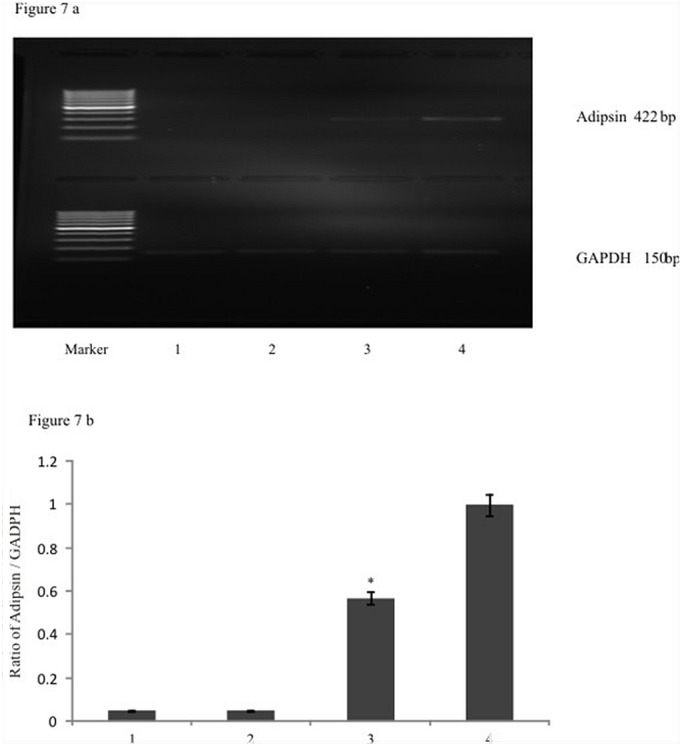
a) EGCG down regulated the adipsin gene expression: RT-PCR analysis of adipsin, glyceraldehydes 3-Phosphate dehydrogenase gene was analyzed in control, DIM treated and DIM Plus EGCG treated cells. The lane-1 represents electrophoretogram of the amplified product (422 bp) from control (without treatment) cells, lane-2 represents EGCG treated cells, lane-3 represents amplified product following DIM and 1μM EGCG treatment and the lane-4 represented the amplification of a product following DIM treatment. It was observed that EGCG treatment down regulated the expression of adipsin in the cells undergoing adipogenesis. (Compare Lane 3 with lane 4). b) The densitometric analysis of amplified adipsin product was analyzed and it was observed that EGCG treatment significantly reduced the expression of adipsin gene expression. The graph represented densitometric analysis of adipsin relative to GADPH. The values represent mean ± SEM of three independent experiments (n=3).