
Figure 3.
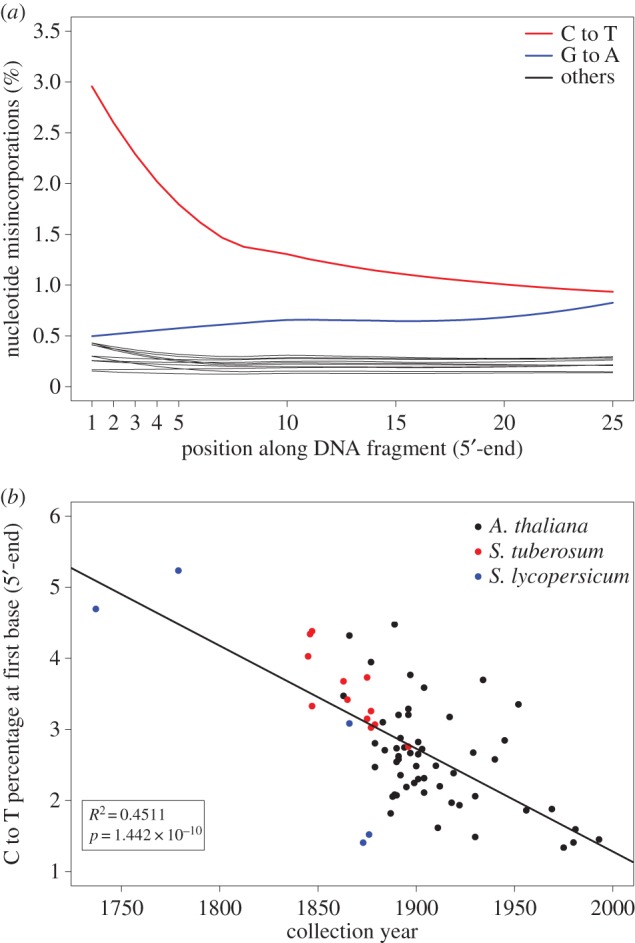
Nucleotide misincorporation. (a) Nucleotide misincorporation profile at 5′-end of the reads of A. thaliana sample NY1365354. The red line shows an excess of C to T substitutions at the beginning of the read that declines exponentially inwards. (b) C to T percentage at first base (5′-end) as a function of collection year (N = 71). The C to T percentage and the collection year have a linear relationship.