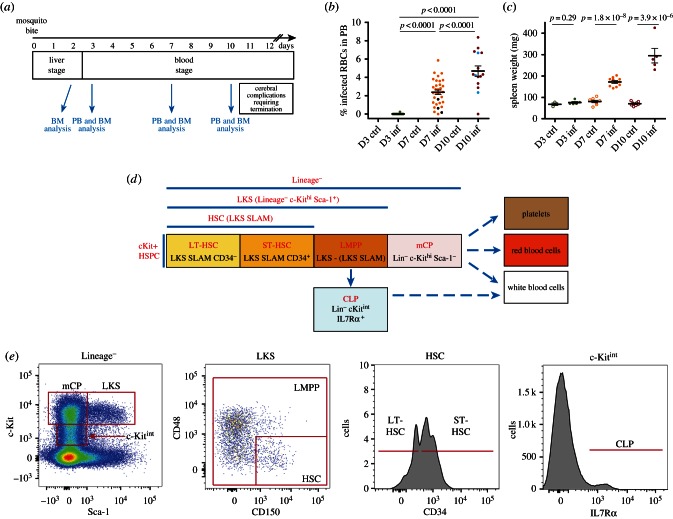
Figure 1.
Analysis of the haematopoietic response to sporozoite P. berghei infection. (a) Timeline of P. berghei-induced malaria onset and time point analysed. On day 0, cohorts of C57/B6 mice were exposed to bites by control or P. berghei-infected A. stephensi mosquitoes. On days 3, 7 and 10 psi, groups of 2–3 control and 3–5 infected mice were culled and their peripheral blood (PB) and bone marrow (BM) cells analysed. Boxes indicate the duration of liver/blood stages of disease and the time of onset of cerebral complications. In this study, we analysed animals from a total of six independent infections. (b) Parasitaemia detected at days 3, 7 and 10 psi. p-Values are not shown but all <0.005 for each pairwise comparison. Black dots in the day 7 pool and light blue dots in the day 10 pool indicate mice that, despite showing parasitaemia, did not mount a dramatic haematopoietic response. n = 20 mice culled and analysed at day 3, 32 at day 7 and 15 at day 10 psi, pooled from six independent infections. (c) Spleen weight for control and infected mice at the times indicated. n = 5 mice culled and analysed at day 3, 10 at day 7 and 5 at day 10 psi, pooled from three independent infections. (d) Schematic of the haematopoietic stem and progenitor cell populations analysed, including phenotypic markers and nomenclature used throughout the manuscript. HSC, haematopoietic stem cells (LT, long-term, ST, short-term repopulating); LMPP, lymphoid and myeloid multipotent progenitors; mCP, myeloid committed progenitors; CLP, common lymphoid progenitors; LKS, Lineage−KithiSca+; SLAM: CD150+CD48−. (e) Gates used to identify the cell populations in (d) using flow cytometry analysis. Above each plot is indicated the population shown, and boxes indicate how subpopulations were identified based on the expression levels of cell surface markers.

