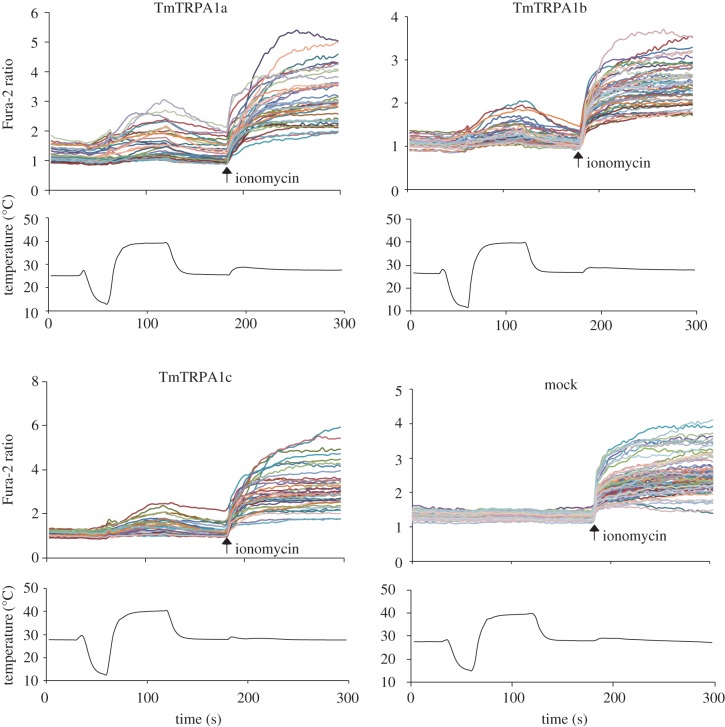
Figure 2.
Heat activation of three TmTRPA1 isoforms. The upper traces indicate the changes of Fura-2 ratio (intracellular calcium level) in TmTRPA1a-, TmTRPA1b-, TmTRPA1c- or mock-transfected cells on temperature fluctuation in the presence of extracellular calcium. Each line represents the Fura-2 ratio in the individual cell measured by calcium imaging. The arrows show the time points when ionomycin was added. The lower traces show the changes of bath temperature by time.

