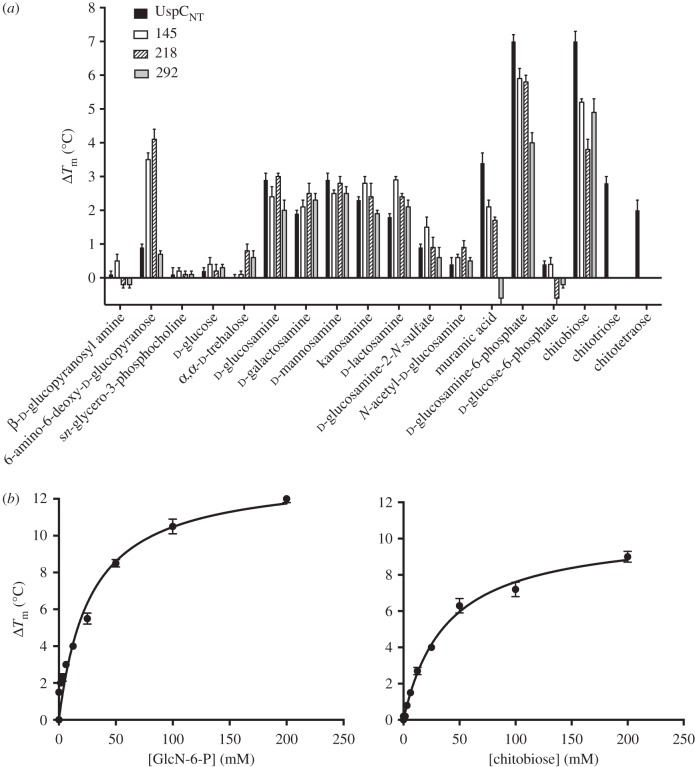
Figure 3.
Thermal shift assay probing a panel of potential UspC ligands. (a) Bar graph illustrating shifts of Tm for a series of carbohydrates. Data shown are from three independent repeats. UspCNt mutants carrying a single alanine substitution at Asp145, Gln218 or Tyr292 are labelled as 145, 218 or 292, respectively. (b) Saturation binding curve derived from the thermal shift data varying the ligand concentration (0–200 mM). The apparent dissociation equilibrium constants Kd,app derived from these data by fitting a single-site saturation binding model are 27.7 ± 6.4 mM (d-glucosamine-6-phosphate) and 38.1 ± 3.5 mM (chitobiose).

