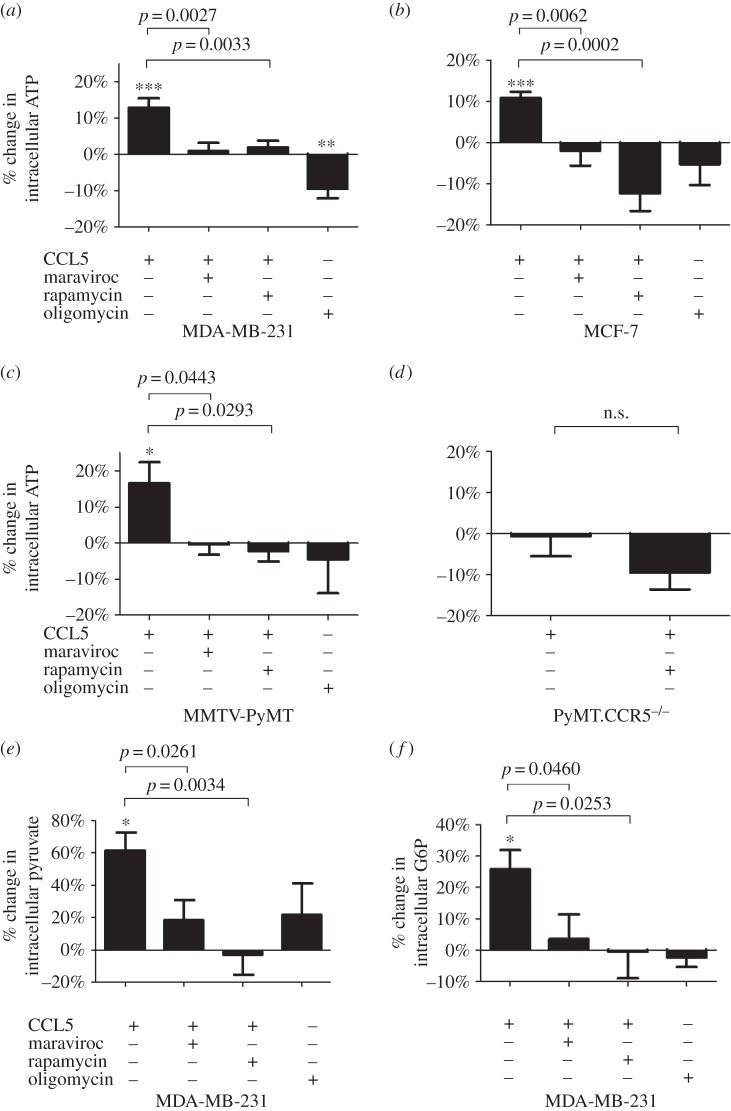
Figure 5.
CCL5 treatment increases ATP and glycolytic intermediate flux. (a–d) Cells were either left untreated, treated with 10 nM CCL5 for 3 h or pre-treated with 2 µM maraviroc or 50 nM rapamycin for 1 h prior to CCL5 treatment for 3 h. Oligomycin is included as a control. The percentage change in intracellular ATP levels relative to untreated (medium alone) cells is shown. Values are means ± s.e. of triplicate assays and each data point combines the data from two independent experiments. Statistical analysis was performed comparing different treatments, with p-values as indicated or comparing untreated cells with CCL5 treatment: *p < 0.05, **p < 0.01, ***p < 0.001. MDA-MB-231 cells were either left untreated, treated with 10 nM CCL5 for 3 h or pre-treated with 2 µM maraviroc or 10 nM rapamycin for 1 h prior to CCL5 treatment for 3 h. The percentage change in intracellular pyruvate (e) and glucose 6-phosphate (G6P) (f) relative to untreated (medium alone) cells is shown. Values are means ± s.e. of triplicate assays and each data point combines the data from two independent experiments. Statistical analysis was performed comparing different treatments, with p-values as indicated or comparing untreated cells with CCL5 treatment: *p < 0.05.

